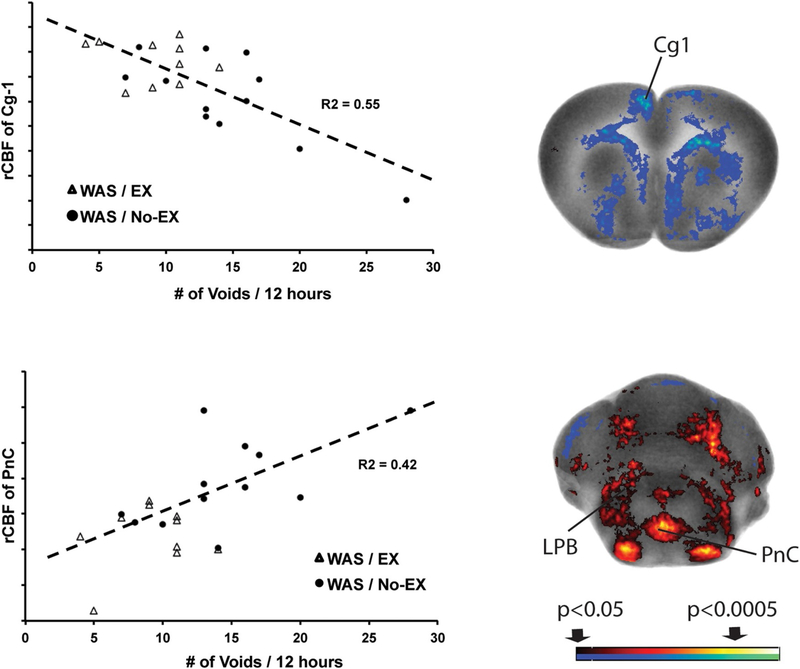
Fig. 6.
Correlation of urinary frequency and rCBF. Significant correlations between the urinary frequency at the end of the third week of exercise and rCBF across the combined WAS/ EX and WAS/No-EX groups (n = 10–12 per group). The right column shows representative coronal sections at the level of the dorsal cingulate cortex region (+2.3 mm anterior to bregma) and the caudal portion of the pontine reticular nucleus (−9.7 mm posterior to bregma) that shows correlation of rCBF. Red and blue colors showing significant positive and negative correlations (p < 0.05 for clusters of >100 contiguous significant voxels). The left column graphically depicts the correlation of urinary frequency with rCBF of the dorsal cingulate cortex and the pons. Abbreviations: Cg1, dorsal cingulate; LPB, lateral parabrachial nucleus; PnC, pontine reticular nucleus, caudal. (For interpretation of the references to color in this figure legend, the reader is referred to the web version of this article.)

