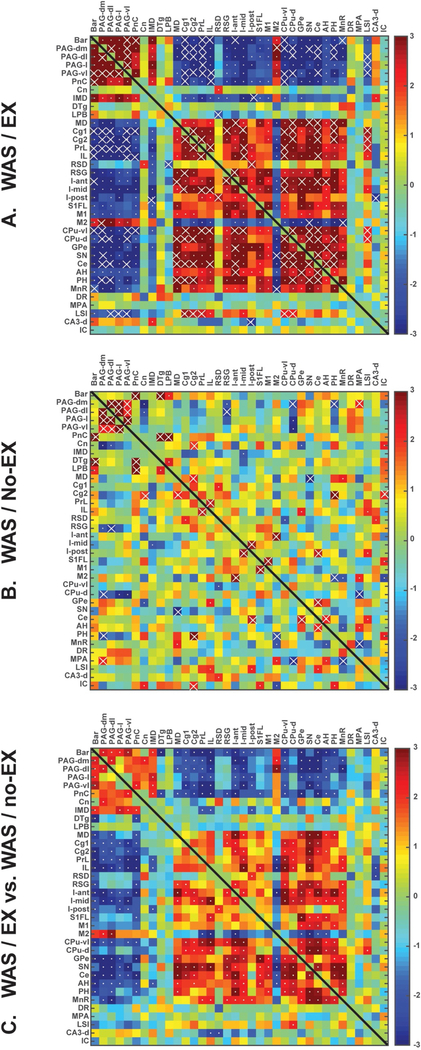
Fig. 7.
Functional brain connectivity within the extended micturition circuit during passive bladder distention. Interregional correlation matrix shows functional connectivity patterns of (A) WAS/EX and (B) WAS/no-EX. Z scores of Pearson’s correlation coefficients are color-coded with significant correlations marked with a white dot. Significant correlations (p < 0.05) determined by the more conservative jackknife procedure are marked with white crosses. (C) The matrix of Fisher’s Z-statistics represents differences in Pearson’s correlation coefficients (r) between the WAS/EX and the WAS/no-EX group. Positive Z-values indicate greater r in the WAS/EX group, while negative Z-values smaller r. Significant between-group differences (p < 0.05) are marked with white dots. Abbreviations as appearing along the figures’ axes: Bar, Barrington’s n; PAG-dm, Periaqueductal gray, dorsomedial; PAG-dl, Periaqueductal gray, dorsolateral; PAG-l, Periaqueductal gray, lateral; PAG-vl, Periaqueductal gray, ventrolateral; PnC, Pons, reticular n., caudal; Cn, Cuneiform n; IMD, Intermediodorsal n. (thalamus); DTg, Dorsal Tegmental area; LPB, Lateral parabrachial area; MD, Mediodorsal n. (thalamus); Cg1, Cingulate, dorsal; Cg2, Cingulate, ventral; PrL, Prelimbic cortex; IL, Infralimbic cortex; RSD, Retrosplenial cortex, dysgranular; RSG, Retrosplenial cortex, granular; I-ant, Insula, anterior; I-mid, Insula, midl; I-post, Insula, posteriorl; S1FL, Primary somatosensory cx, forelimb; M1, Primary motor cortex; M2, Secondary motor cortex; CPu-vl, Striatum, ventrolateral; CPu-d, Striatum, dorsal; GPe, Globus pallidus, external; SN, Substantia nigra; Ce, Central n. (amygdala); AH, Anterior hypothalamus; PH, Posterior hypothalamus; MnR, Median raphe; DR., Dorsal raphe; MPA, Medial preoptic area; LSI, Lateral septal n., intermediate; CA3-d, CA3, dorsal hippocampus; IC, Inferior colliculus.

