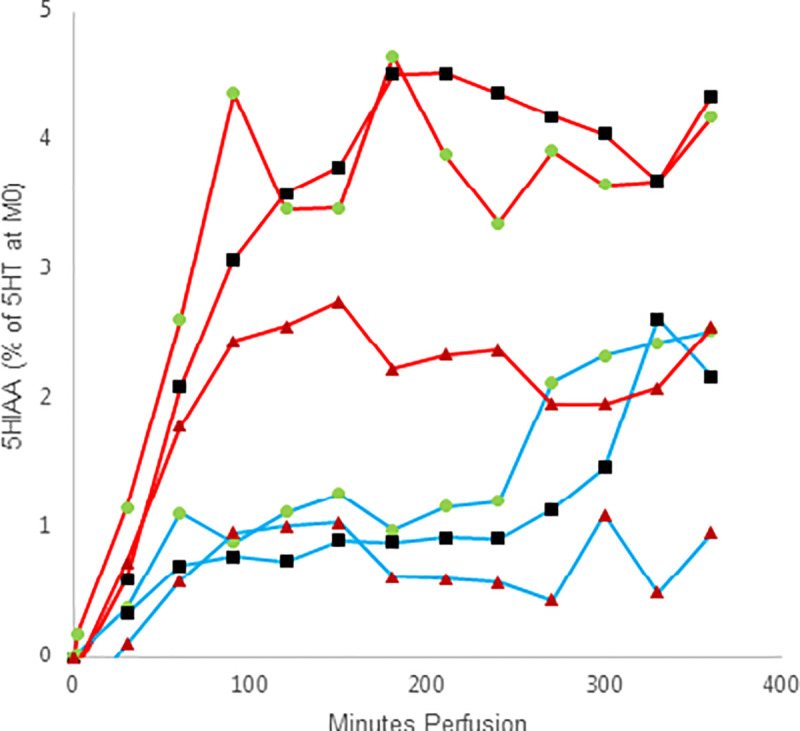
Fig 4. Placental perfusion with 5-HIAA.

The graphs shows maternal (red) and fetal (blue) mean 5-HIAA concentration presented as percentage (%) of the 5-HT concentration in the maternal sample at time 0 minutes perfusion, without (green circle, n = 6) and with the addition of fluoxetine (black square, n = 4) and PCPA (red triangle, n = 5). The concentration of 5-HIAA in nM at each time point is subtracted the 0/before-sample concentration in nM in each perfusion on maternal and fetal side respectively.
