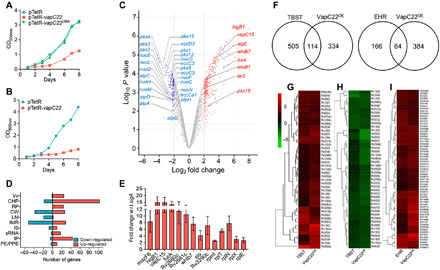
Fig. 1. Effect of overexpression of VapC22 on growth and transcriptomics of M. tuberculosis.

(A and B) The expression of VapC22 and VapC22D8A in M. bovis BCG (A) and M. tuberculosis (B) was induced by the addition of Atc. The growth of various strains was determined by measuring absorbance at 600 nm at regular intervals. The data shown in these panels are representative of three independent experiments. (C to I) Differential gene expression in M. tuberculosis upon VapC22 overexpression. Four hundred forty-seven genes were significantly differentially expressed upon overexpression of VapC22 in M. tuberculosis. (C) The volcano plot displaying gene expression profiles observed 24 hours after VapC22 expression in M. tuberculosis. The y and x axes depict P value and fold change for each gene, respectively. The statistically significant differentially expressed induced and repressed transcripts are highlighted as red and blue dots, respectively. (D) The number of induced and repressed transcripts categorized by functional category is shown. (E) The transcript levels of various differentially expressed genes between the parental and VapC22 overexpression strain at 24 hours after Atc induction were quantified. The data shown in this panel are means ± SE of fold change in the overexpression strain relative to the parental strain obtained from three independent experiments. wrt with respect to (F) Venn diagram showing correlation of differentially expressed genes in VapC22 overexpression strain with nutritionally starved proteome and enduring hypoxia response transcriptome studies. (G to I) Heat maps showing fold change in expression of common genes up-regulated (G) and down-regulated (H) in VapC22 overexpression strain and nutritionally starved bacteria. The common genes up-regulated in our and EHR (enduring hypoxia response) transcriptome are shown in (I). w.r.t., with respect to.
