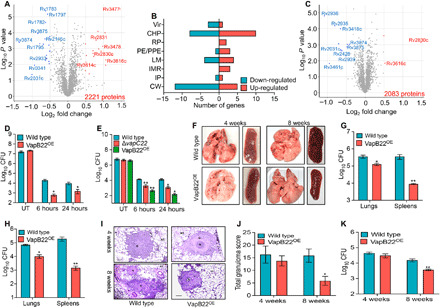
Fig. 3. Effect of VapB22 overexpression on survival of M. tuberculosis under oxidative stress condition and host tissues.

(A and B) Proteome comparison of parental and ΔvapC22 strains of M. tuberculosis. (A) Volcano plots represent proteome comparisons of the mid-log phase cultures of ΔvapC22 to the parental strain. The number of proteins compared is mentioned in the bottom-right side of the plot. The statistically significant differentially expressed proteins are highlighted as red (increased) and blue (decreased) dots, respectively. The y and x axes depict P value and fold change for each protein, respectively. (B) The number of differentially expressed proteins in ΔvapC22 strain is categorized by their functional category. (C) Proteome comparison of M. tuberculosis strains harboring either vector or VapB22 overexpression construct. Volcano plot representing proteome comparison of mid-log phase cultures from the parental and VapB22 overexpression strains. The number of proteins identified is mentioned in the bottom right side of the panel. The statistically significant differentially expressed proteins are highlighted as red (increased) and blue dots (decreased), respectively. The y and x axes depict P value and fold change for each protein, respectively. (D and E) Overexpression of VapB22 increases susceptibility of both M. tuberculosis and M. bovis BCG upon exposure to oxidative stress. Various M. tuberculosis (D) and M. bovis BCG (E) strains were exposed to oxidative stress, and CFU enumeration was performed. The results shown in these panels are means ± SE of log10 CFU obtained from three independent experiments. Statistically significant differences were observed for the indicated groups (paired-two tailed t test, *P < 0.05 and **P < 0.01). (F to K) The M. tuberculosis VapB22 overexpression strain is attenuated for growth in guinea pigs and immunocompetent mice. (F) Representative image of the lungs and spleens of guinea pigs infected with parental and overexpression strains at 4 and 8 weeks after infection via aerosol route. Photo credit: Sakshi Agarwal, Translational Health Science and Technology Institute. (G and H) The growth of parental and overexpression strains in guinea pigs was assessed by determining lung and splenic bacillary loads at 4 weeks (G) and 8 weeks (H) after infection. The data shown in these panels are means ± SE of log10 CFU obtained from six or seven animals per group per time point. (I) For histopathology analysis, H&E-stained sections of lungs infected with parental and overexpression strain were viewed at a magnification of ×40. Scale bars, 200 μm. Photo credit: Ashok Mukherjee, National Institute of Pathologist. (J) The total granuloma score in H&E-stained sections from guinea pigs infected with various strains was determined. The data shown in this panel are means ± SE of data obtained from six or seven animals per group. (K) Female Balb/c mice were infected with wild-type and VapB22 overexpression strain, and CFU counts were determined in the lungs at 4 and 8 weeks after infection. The data shown in this panel in means ± SE of log10 CFU obtained from five mice per group per time point. Statistically significant differences were obtained for the indicated groups (paired-two tailed t test, *P < 0.05 and **P < 0.01).
