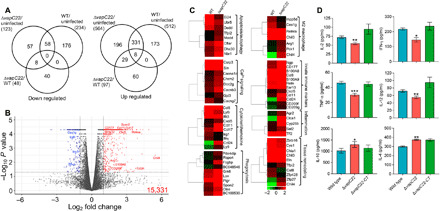
Fig. 4. Global transcriptome profile and immune response of lung tissues from uninfected mice and from mice infected with either wild-type or ΔvapC22 strain of M. tuberculosis.

(A) Venn diagram showing correlation of expression profiles obtained from lung tissues of uninfected, wild type (WT)–infected, and ΔvapC22-infected mice. (B) The volcano plot showing comparison of gene expression profiles from mice infected with parental and ΔvapC22 strain of M. tuberculosis. The genes that are significantly up-regulated or down-regulated by more than 2.0-fold have been highlighted as blue and red dots, respectively. The y and x axes depict P value and fold change for each gene, respectively. (C) Heat map showing transcripts differentially expressed by 4.0-fold in lung tissues of mice infected with wild-type and ΔvapC22 strain after 4 weeks of infection. The gene names and pathways are indicated to the right of heat map, and growth conditions are mentioned at the top. The data shown are obtained from three biological replicates. (D) The levels of intracellular cytokines in lung homogenates from 4-week infected mice were assayed by enzyme-linked immunosorbent assay as per the manufacturer’s recommendations. Significant differences were obtained for the indicated groups (paired-two tailed t test, *P < 0.05, **P < 0.01, and ***P < 0.001).
