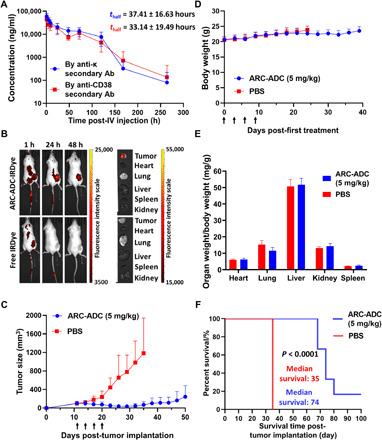
Fig. 3. Pharmacokinetics and pharmacodynamics in mice.

(A) Pharmacokinetics of CD38 C-fusion IgG in mice. A single dose (3 mg/kg) of CD38 C-fusion IgG was administered by intravenous (IV) injection into CD-1 mice (n = 5). Plasma concentrations of CD38 C-fusion IgG were determined by two sandwich ELISAs using the same capture antibody (Ab) [anti-human IgG (H+L)] but different detection antibodies (anti-κ light chain or anti-CD38). (B) Biodistribution of anti-HER2 ARC-ADC in mice. HCC1954 cells were subcutaneously implanted into the flank of female NSG mice. IRDye-labeled anti-HER2 ARC-ADC (5 mg/kg) or free IRDye at the same molar concentration was administered intravenously through tail vein 1 week after tumor implantation. Mice were then imaged at 1, 24, and 48 hours after injection, followed by euthanasia and imaging of harvested tumors and major organs. (C) In vivo efficacy of anti-HER2 ARC-ADC. HCC1954 cells were subcutaneously implanted into the flank of female NSG mice. Once the tumor sizes reached 100 mm3, mice (n = 6) were treated with PBS or ARC-ADC (5 mg/kg) by intravenous injection (black arrows) every 3 days for a total of four times. (D) Body weights of mice during the in vivo efficacy study. (E) Ratios of major organ weight to body weight of mice at the end of in vivo efficacy study. (F) Kaplan-Meier survival curve for PBS- and ARC-ADC–treated groups.
