
Fig. 6. Protein capture and partitioning in DNA droplets.
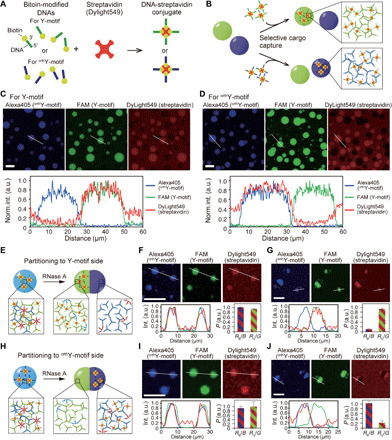
(A) Streptavidin modified with biotinylated-DNAs that have SE sequences for Y- and orthogonal Y-motifs (orthY-motifs). (B) The DNA-modified streptavidin can be captured in DNA droplets in a sequence-dependent manner. (C and D) Microscopic images and line profiles representing localization of streptavidin modified with SEs for Y- (C) or orthY-motifs (D). The bottom graphs show normalized intensity profile of each fluorophore on the line shown in the above images. (E and H) Schematic of partitioning DNA-modified streptavidin to the portion composed of Y- (E) or orthY-motifs (H). (F and G) Microscopic images of DNA droplets and streptavidin modified with SEs for Y-motifs before (F) and after (G) the addition of RNase A. The bottom left graphs show normalized intensity profile of each fluorophore on the line shown in the above images. The bottom right graphs show the partitioning coefficient value, P. RB/B and RG/G indicates the fluorescence intensity ratio of Dylight549 fluorescence (streptavidin) on Alexa405 fluorescence (orthY-motif) and on FAM fluorescence (Y-motif), respectively, on the line profile (detailed methods on how to obtain the P values have been described in Materials and Methods). Error bars indicate SD (mean ± SD, n = 5). (I and J) Microscopic images of DNA droplets and streptavidin modified with SEs for orthY-motifs before (I) and after (J) the addition of RNase A. The bottom left graphs show normalized intensity profile of each fluorophore on the line shown in the above images. The bottom right graphs show P. Error bars indicate SD (mean ± SD, n = 5). Scale bars, 30 μm (C and D), 20 μm, (other images).