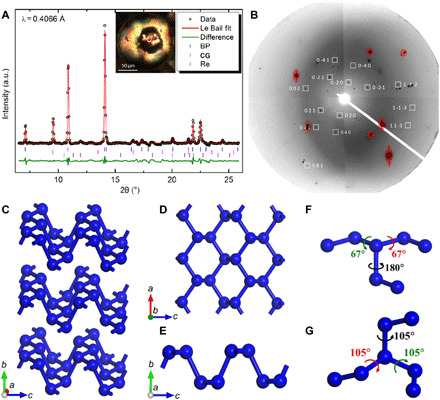
Fig. 1. XRD characterization and illustration of the crystal structure of BP-structured nitrogen.

(A) Le Bail fit of XRD data at 132 GPa. Black circles, red line, and green line represent experimental data, Le Bail fitting, and residual, respectively. Blue, pink, and purple ticks mark reflections for BP-structured nitrogen, CG-nitrogen, and Re, respectively. Inset shows the microscopic image of the sample under illumination with both reflected and transmitted light, with the white circle marking the sample position being measured. BP and CG stand for BP-structured nitrogen and CG-nitrogen, respectively. (B) 2D x-ray diffraction (XRD) image from grain #2. White boxes mark the diffraction spots of BP-structured nitrogen. Numbers indicate corresponding Miller indices. Image is obtained by merging selected step scan patterns that contain BP-structured nitrogen reflections for demonstration. (C) Crystal structure of BP-structured nitrogen. (D and E) Single nitrogen layer in BP-structured nitrogen. (F and G) Dihedral angles in BP-structured nitrogen and CG-nitrogen calculated at 132 GPa, respectively. a.u., arbitrary units.
