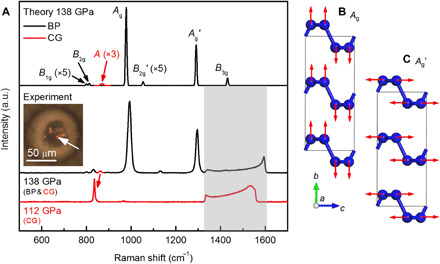
Fig. 2. Identification of the BP structure by Raman spectrum.

(A) Raman spectra from sample 1 measured at 138 GPa and sample 2 measured at 112 GPa compared with the superposition of two calculated spectra for BP-structured nitrogen (black) and CG-nitrogen (red) at 138 GPa. Gray shade marks the region of phonon from stressed diamond anvil, which hides B3g of BP-structured nitrogen. Inset shows photomicrograph of the sample, with the white arrow marking the sample position being measured. A mode of CG-nitrogen at 112 GPa shifts to a lower frequency compared with the spectrum at 138 GPa. Red arrow between the experiment spectra correlates the two A modes of CG-nitrogen at different pressures. (B and C) Schematic of atomic displacements of the Ag and Ag′ modes.
