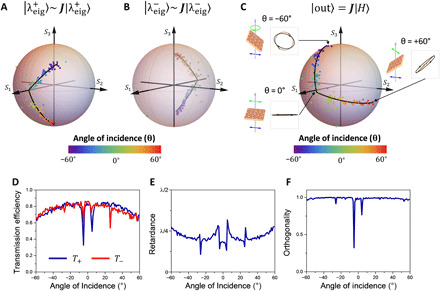
Fig. 4. Measurement results for a continuous angular range.

(A and B) Measured eigen-polarization states at various angles of incidence. The color represents the angle of incidence (θ). Both the ellipticity and the orientation, which is related to the latitude and longitude of the Poincaré sphere, respectively (fig. S7), of the eigen-polarization states vary significantly as a function of the angle of incidence. The solid black line is a fitted curve of the trajectory. (C) Measured output polarization states (∣out⟩) for a fixed incident polarization state ∣H⟩. As θ angle changes from −60° to 60°, the output polarization state follows a nonconventional trajectory on the Poincaré sphere, which goes continuously from nearly right circular polarization (S3) through horizontal linear polarization (S1) to nearly 45° linear polarization (S2). The schematic, as well as the measured (black) and simulated (brown) polarization ellipses at 0° and ±60°, are highlighted in the insets. (D) Measured transmission efficiency for the two eigen-polarization states (blue line) and (red line). The transmission dips result from excitation of guided mode resonances. (E) Measured retardance. (F) Measured orthogonality of the two eigen-polarization states. It is defined as . Away from the resonances, the two eigenstates are almost orthogonal.
