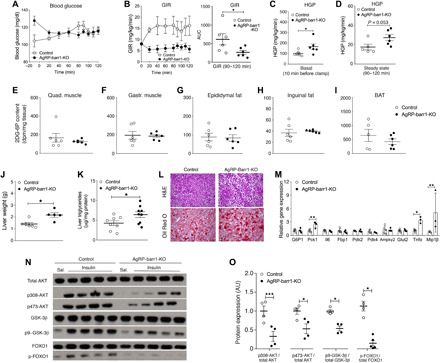
Fig. 2. HFD AgRP-barr1-KO mice exhibit increased HGP and impaired hepatic insulin signaling.

All studies were carried out with male HFD AgRP-barr1-KO and control littermates. (A to D) Euglycemic-hyperinsulinemic clamp studies. (A) Blood glucose levels. (B) GIR. AUC, area under the curve. (C and D) HGP under basal (C) and steady-state conditions (D). (E to I) Tissue glucose uptake by skeletal muscle and adipose tissues after intraperitoneal insulin (0.75 U/kg) injection. (J) Liver weights (HFD for 12 weeks; age, 20 weeks). (K) Liver triglyceride levels (HFD for 12 weeks; age, 20 weeks). (L) Histological staining of liver sections (HFD for 12 weeks; age, 20 weeks). (M) Hepatic expression levels of genes involved in gluconeogenesis and inflammatory processes (HFD for 12 weeks; age, 20 weeks). (N) Hepatic insulin signaling studied by Western blotting analysis after intravenous insulin (5 U per mouse) (HFD for 12 weeks; age, 20 weeks). (O) Quantification of the Western blotting data shown in (N). The data shown in (K) to (O) were obtained with mice that had been fasted for 4 hours. Data are given as means ± SEM (n = 5 to 9 male mice per group). *P < 0.05; **P < 0.01; ***P < 0.001 (Student’s t test). AU, arbitrary units.
