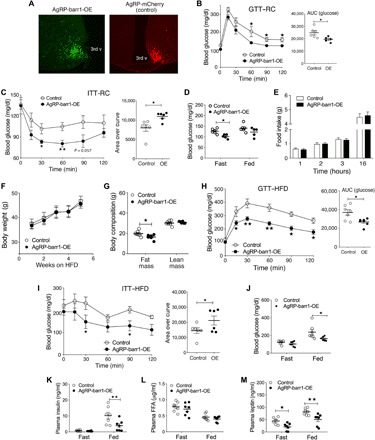
Fig. 5. Overexpression of barr1 in AgRP neurons improves whole-body glucose tolerance and insulin sensitivity in lean and obese mice.

Experiments were carried out with male mice maintained on regular chow (RC) (A to I) or with male mice that had consumed an HFD for at least 7 weeks (F to M). (A) Representative immunofluorescence images showing the expression of mCerulean (left), a marker for barr1 overexpression, and mCherry (control mice; right) in the arcuate nucleus of AgRP-barr1-OE and AgRP-mCherry mice, respectively. 3rd v, third ventricle. (B) Glucose tolerance test (1 g glucose/kg i.p.) carried out with regular chow AgRP-barr1-OE and control mice (age, 12 weeks). (C) Insulin tolerance test (0.75 U/kg i.p.) (11-week-old regular chow mice). (D) Fasting and fed blood glucose levels (regular chow mice, 11 to 12 weeks old). (E) Food intake of regular chow AgRP-barr1-OE and control mice after a 24-hour fast (refeeding; mouse age, 13 weeks). (F) Body weight gain of AgRP-barr1-OE and control mice consuming an HFD (mouse age, 13 to 17 weeks). (G) Fat and lean mass composition of HFD AgRP-barr1-OE and control mice (mouse age, 22 weeks; 9 weeks on HFD). (H) Glucose tolerance test (1 g glucose/kg i.p.) carried out with HFD AgRP-barr1-OE and control mice (mouse age, 21 weeks; 8 weeks on HFD). (I) Insulin tolerance test (0.75 U/kg i.p.) (mouse age, 20 weeks; 7 weeks on HFD). (J to M) Fasting and fed blood glucose (J) and plasma insulin (K), FFA (L), and leptin (M) levels (mouse age, 20 to 22 weeks; 7 to 9 weeks on HFD). Data are given as means ± SEM (n = 6 to 9 mice per group). *P < 0.05; **P < 0.01 [two-way ANOVA followed by Bonferroni’s post hoc test (B, C, H, and I) and two-tailed Student’s t test (D, G, and J to M)].
