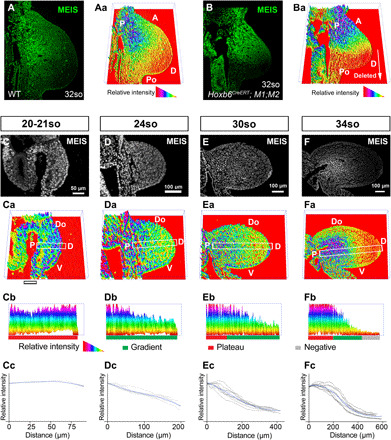
Fig. 2. Meis protein forms a PD gradient that changes dynamically in correlation with the progressive distalization of the limb bud.

(A) Meis immunofluorescence in a WT FL bud from a 32-somite (so) embryo (~E10.5) and (Aa) its quantification represented in three dimensions (3D). (B and Ba) As a quantification control, the same analysis is shown in a HoxB6CreERT;M1KO;M2KO FL bud, in which only the posterior region lacks Meis proteins according to the reported HoxB6CreER recombination pattern after tamoxifen induction at E8.5 (27). (C to Fa) Temporal sequence of Meis distribution and corresponding 3D quantification plots showing individual representative examples of 20-21so to 34so stages (~E9.5 to E10.5). (Cb to Fb) PD cross sections of Meis abundance along the indicated rectangles in (Ca) to (Fa), with exclusion of the ectodermal signal. The rectangles align with the line of maximal Meis variation along the limb bud PD axis (see Materials and Methods). (Cc to Fc) Graphical representation of Meis gradient quantification at each stage. Black lines represent the individual replicates (see Materials and Methods and fig. S4 for a detailed explanation), and blue lines represent the loess curve fitted from the replicates. The gray shadow represents the 95% confidence interval of the loess curve. A, anterior; Po, posterior; P, proximal; D, distal; Do, dorsal; V, ventral. Scale bars, 50 μm (C) and 100 μm (D to F).
