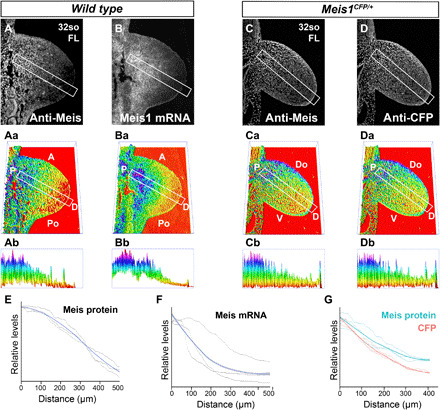
Fig. 6. Transcriptional regulation of Meis gradient formation.

Detection of Meis protein distribution by immunofluorescence (A) and Meis1 mRNA by in situ hybridization (B) in adjacent sections of FL buds. (Aa and Ba) 3D representation of the signals detected in (A) and (B), respectively. (Ab and Bb) PD cross sections of Meis abundance along the indicated rectangles in (Aa) and (Ba). The rectangles align with the line of maximal Meis variation along the limb bud PD axis (see Materials and Methods). Detection of Meis protein (C) and CFP (D) detection by immunofluorescence in limb buds of mice heterozygous for a Meis1 knock-in allele in which the CFP reporter is inserted at the endogenous Meis ATG. Limb cells express CFP from this allele and endogenous Meis from the unaltered allele. (Ca and Da) 3D representation of the signals detected in (C) and (D), respectively. (Cb to Db) PD cross sections of Meis abundance along the indicated rectangles in (Ca) and (Da), with exclusion of the ectodermal signal. The rectangles align with the line of maximal Meis variation along the limb bud PD axis (see Materials and Methods). (E to G) Graphical representation of Meis protein, Meis mRNA, and CFP quantifications. Black lines represent the individual replicates (see Materials and Methods and fig. S4 for a detailed explanation), and colored lines represent the loess curve fitted from the replicates. The gray shadow represents the 95% confidence interval of the loess curve. (E and F) Graphs showing the quantification of MEIS protein and Meis mRNA, respectively, in adjacent sections. (G) Graph showing the quantification of Meis protein and CFP in adjacent sections.
