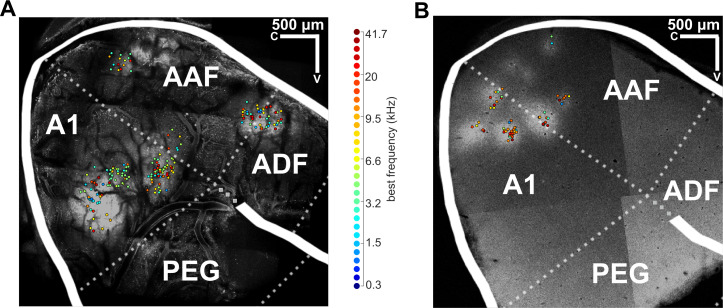
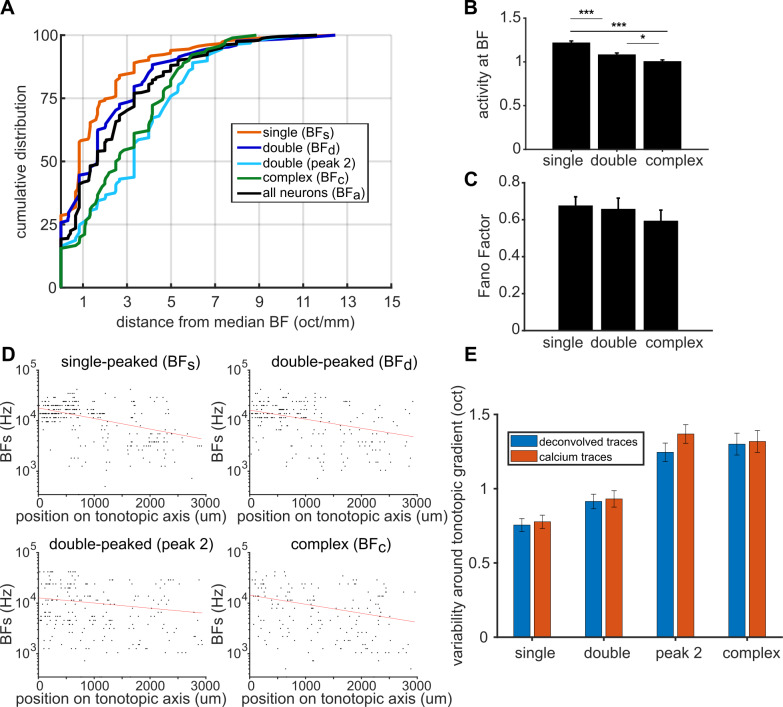
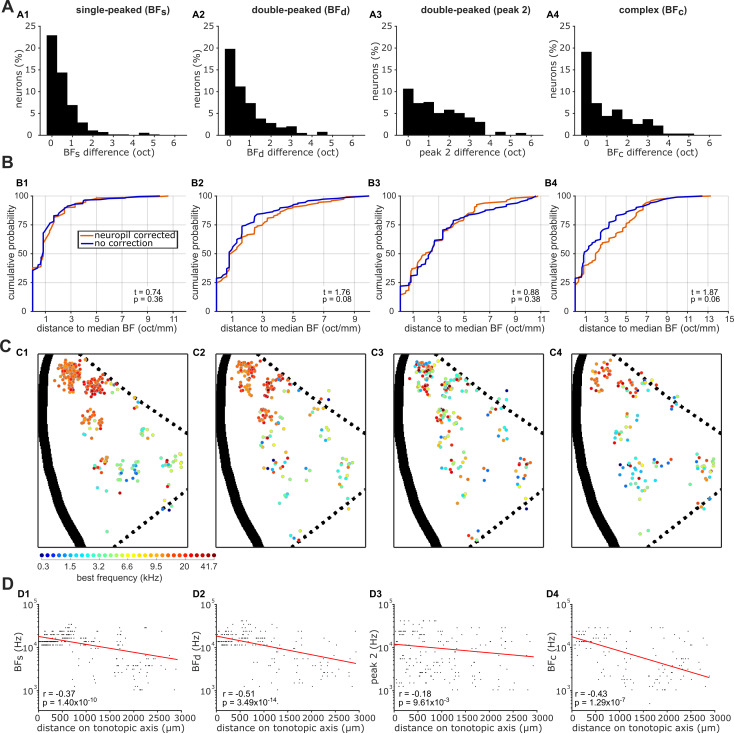
Figure 4. Global tonotopic organization of frequency preferences in ferret A1.
The anatomical locations of neurons imaged across eight ferrets were projected onto a template map of auditory cortex, shown in the top-left corner. Thick black solid lines indicate sulci, and black dotted lines indicate approximate borders between known cortical fields. The two boxes represent the location of A1 (large box; A) and the most dorsal region of A1 (small box; B). The colored line illustrates the tonotopic gradient. (A) The BFs of individual neurons are color-coded (legend above) and mapped onto A1. The spatial distributions of BFs (A1), BFd (A2), peak 2 of double-peaked neurons (A3), and BFc (A4) are plotted separately. (B) Frequency preferences are mapped as in (A) for the dorsal tip of A1, where many neurons are occluded in (A). (C) BFs (C1), BFd (C2), peak 2 (C3), and BFc (C4) of each neuron are plotted against the neuron’s position along the tonotopic axis on the template A1. Red lines show the best single-term exponential fits to the data, and Pearson’s correlations (r) with their p-values (p) are also shown.


