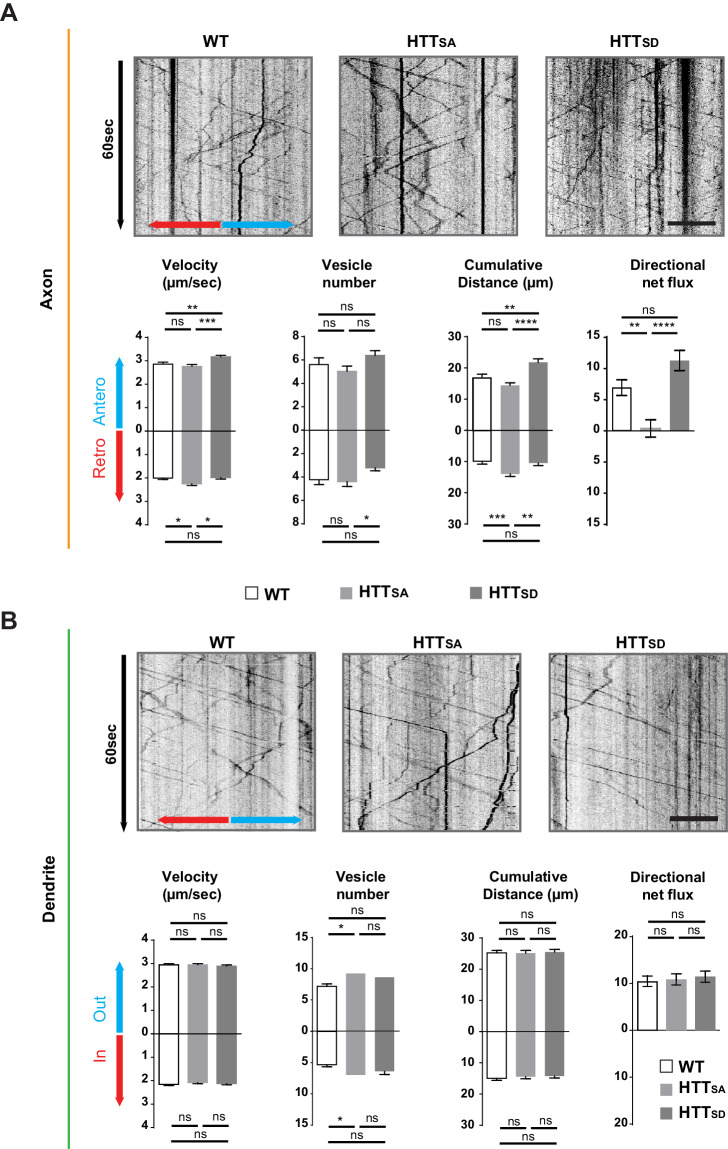
Figure 3. Axonal but not dendritic transport of APP depends on HTT phosphorylation.
(A) Kymographs and quantifications of APP-mCherry into WT, HTTSA and HTTSD axons. Velocity, vesicle number per 100 µm of neurite length, cumulative distance and directional net flux were measured. Histograms represent means +/- SEM of 3 independent experiments, 41 WT, 52 HTTSA and 63 HTTSD axons and 674 WT, 602 HTTSA and 493 HTTSD vesicles. Significance was determined using an unpaired t-test; *p<0.05, **p<0.01, ***p<0.001, ****p<0.0001, ns = not significant. Scale bar = 20 µm. (B) Kymographs and quantifications of APP-mCherry into WT, HTTSA and HTTSD dendrites. Dendritic inward and outward velocity, vesicle number per 100 µm of neurite length, cumulative distance and directional net flux were measured. Histograms represent means +/- SEM of 4 independent experiments, 122 WT, 99 HTTSA and 109 HTTSD dendrites, 1171 WT, 1119 HTTSA and 1074 HTTSD vesicles. Significance was determined using an unpaired t-test; *p<0.05; ns = not significant. Scale bar = 20 µm. (see also Video 3).


