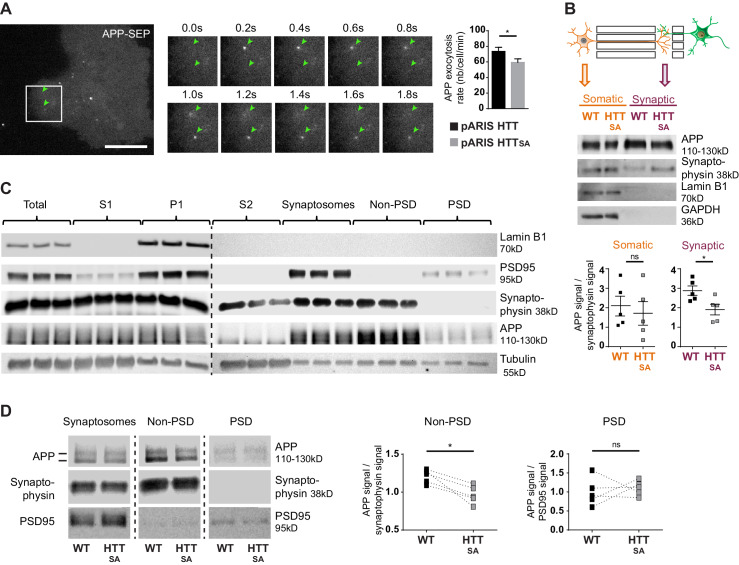
Figure 5. HTT S421 phosphorylation affects presynaptic APP targeting.
(A) Effect of HTT S421 phosphorylation on exocytosis rate of APP was analyzed in COS cells co-transfected with APP-SEP (Super Ecliptic pHluorin) and with pARIS HTT or pARIS HTTSA visualized by TIRF microscopy. Magnification represents a time lapse of events showing 2 events of APP vesicle exocytosis (green arrows). Histograms represent means +/- SEM of exocytosis event number per minute in 39 HTT and 40 HTTSA cells from four independent experiments. Significance was determined using an unpaired t-test; *p<0.05. Scale bar = 20 µm. (see also Video 5). (B) Effect of HTT S421 phosphorylation on APP targeting at the synapse was assessed by anti-APP western blotting (22C11) analysis of extracts from synaptic chambers of a WT or HTTSA corticocortical network. SNAP25 was used as a control for protein content in the synaptic compartment and nuclear marker Lamin B1 for the somatic compartment. Histograms represent means +/- SEM of APP signal per synaptophysin signal on five independent experiments. Significance was determined using a Mann-Whitney test; *p<0.05, ns = not significant. (C) Western blotting analysis of pre- and postsynaptic fractions obtained from synaptosome preparations. Fractionation gives the first pellet, P1, the first supernatant, S1, and the second supernatant, S2. Lamin B1, a nuclear marker is enriched in P1 fraction. The pre- (non-PSD) and the post-synaptic (PSD) fractions are respectively enriched in synaptophysin and PSD95. (D) APP from WT or HTTSA cortices fractions was quantified by western blotting analyses. APP signal was quantified as the ratio of synaptophysin signal for non-PSD fraction and as the ratio of PSD95 signal for PSD fraction. One line represents one experiment. Significance was determined using Mann-Whitney test; *p<0.05, ns = not significant.

