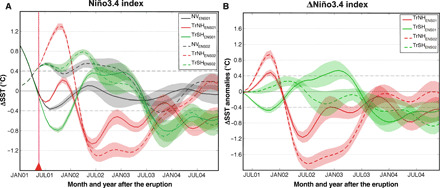
Fig. 3. Niño3.4 index and its changes.

(A) Niño3.4 index for the TrNH and TrSH volcano and no-volcano simulations. In (A), the triangle and the vertical red line highlight the onset of the eruption. (B) Niño3.4 index anomalies (volcano minus no-volcano experiments) for TrNH and TrSH cases. In (B), the anomalies are shown starting from the month of the eruption. The lines represent the ensemble mean, and the shadings represent the SE of the ensemble mean.
