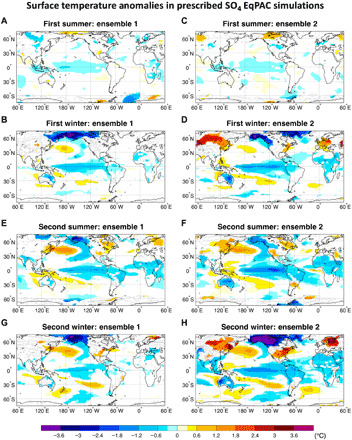
Fig. 5. Changes in surface temperature in EqPAC experiments.

Surface temperature (°C) changes in the first and second summer (June to September (A, C, E, and F) and winter (December to February) (B, D, G, and H) following the EqPAC volcanic forcing for each ensemble. Only values that are significantly different at the 5% level using a local (grid-point) t test are shaded. The contours follow the color bar intervals (solid for positive and dashed for negative anomalies; the zero line is omitted).
