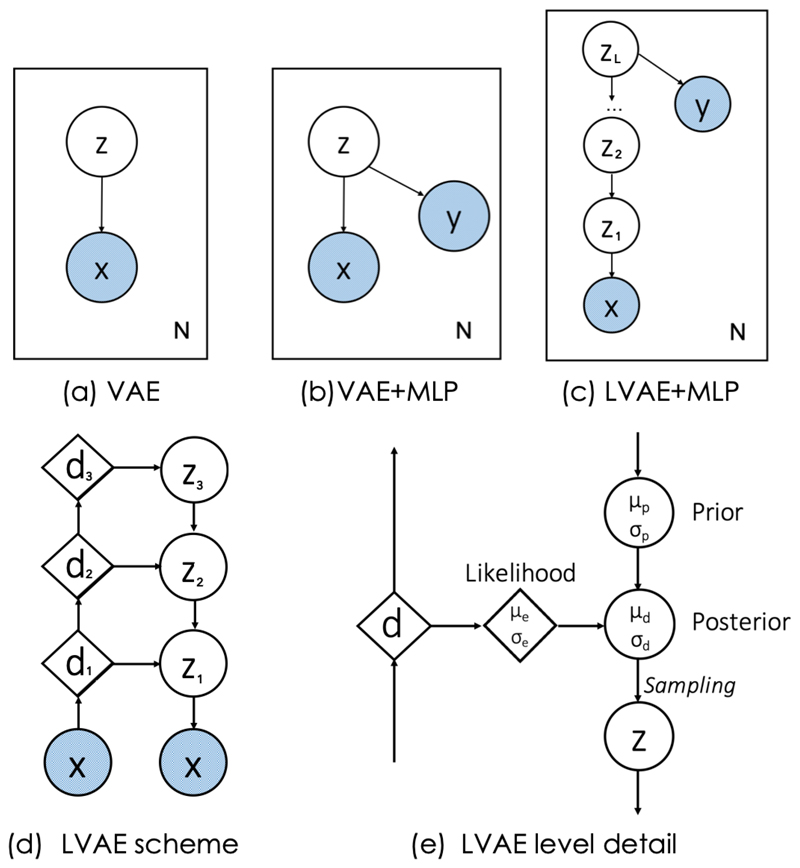
Fig. 1.
Graphical models of a standard VAE (a), of our previously proposed method [30] (b) and the new LVAE-based approach (c). x represents and anatomical segmentation, y the disease class label and z the latent variables to learn. Schematic representation of a three-level LVAE (d) and of the flow of information (e). Circles represent stochastic variables, diamonds represent deterministic variables. Variables in light blue represent the inputs of the network.

