Fig. 2.

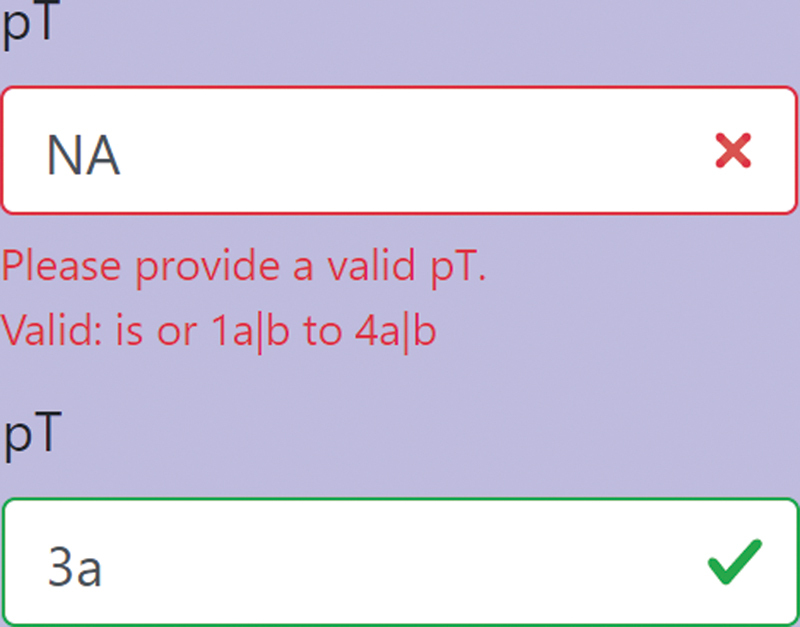
Display of the visual hints for revising input data. The depicted field represents the stage of primary tumor (pT) as an example.

Display of the visual hints for revising input data. The depicted field represents the stage of primary tumor (pT) as an example.