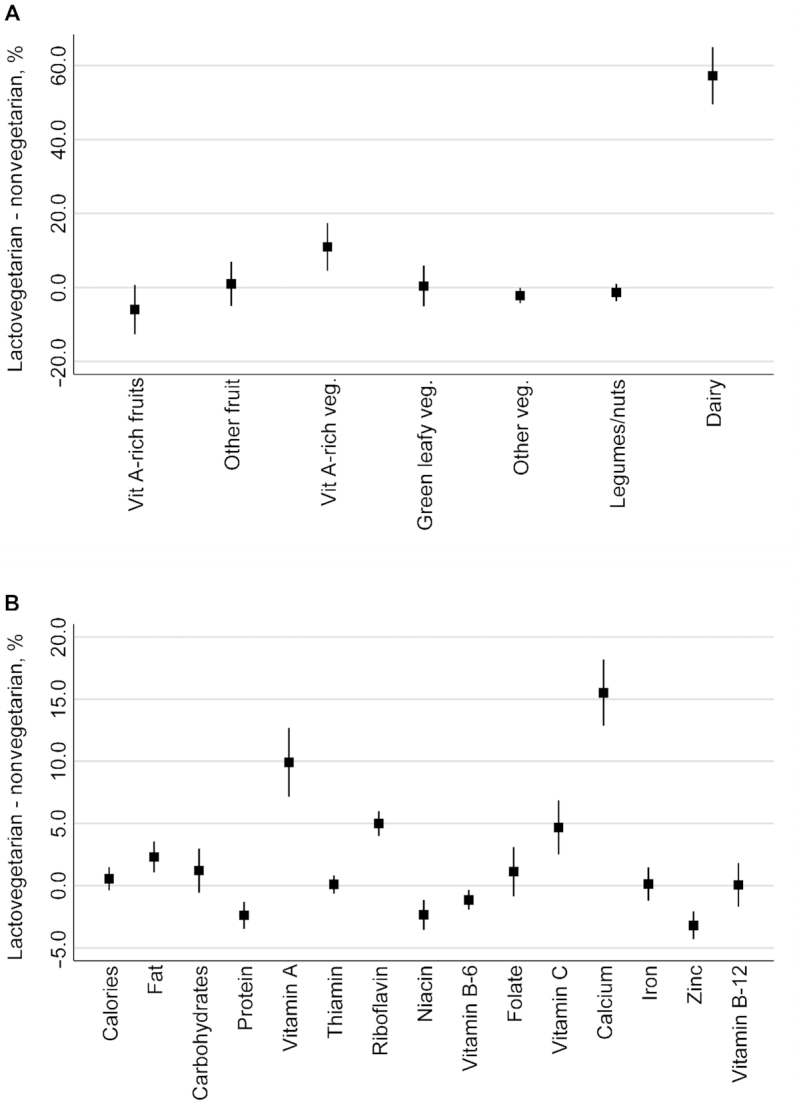
FIGURE 3.

Adjusted regression-based estimates of the percentage differences in per capita availability of foods (panel A) and nutrients (panel B) between lactovegetarian and nonvegetarian households (n = 100,855 households). Panel A: percentage differences in the per capita availability of foods at the household level. Panel B: differences in the per capita availability of nutrients at the household level. Notes: the graphs above denote an approximation of the percentage difference between per capita supply of different foods and nutrients at the household level based on least squares regressions of the log of each food (grams) and nutrient (various units) against dummy variables for household vegetarian status, after adjusting for household characteristics. Each estimate is the result of an individual regression of each food/nutrient after applying the inverse hyperbolic sine transformation to derive an approximation of percentage differences. See Supplemental Table S2 for details of the various control variables used in these regressions.
