
FIGURE 1.
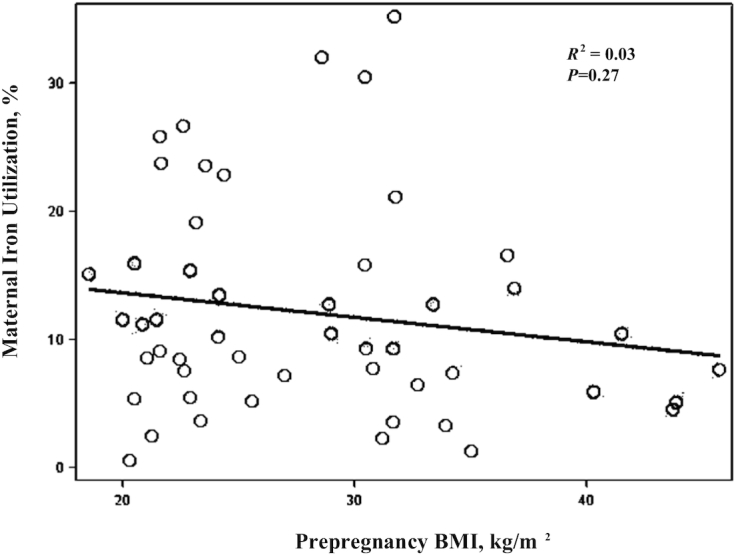
Maternal third-trimester iron utilization percentage by prepregnancy BMI (kg/m2). Scatter plot of prepregnancy BMI on the x-axis and observed (nontransformed) maternal iron utilization percentage on the y-axis, n = 50. The black line is the regression fit estimate.