Fig. 5.
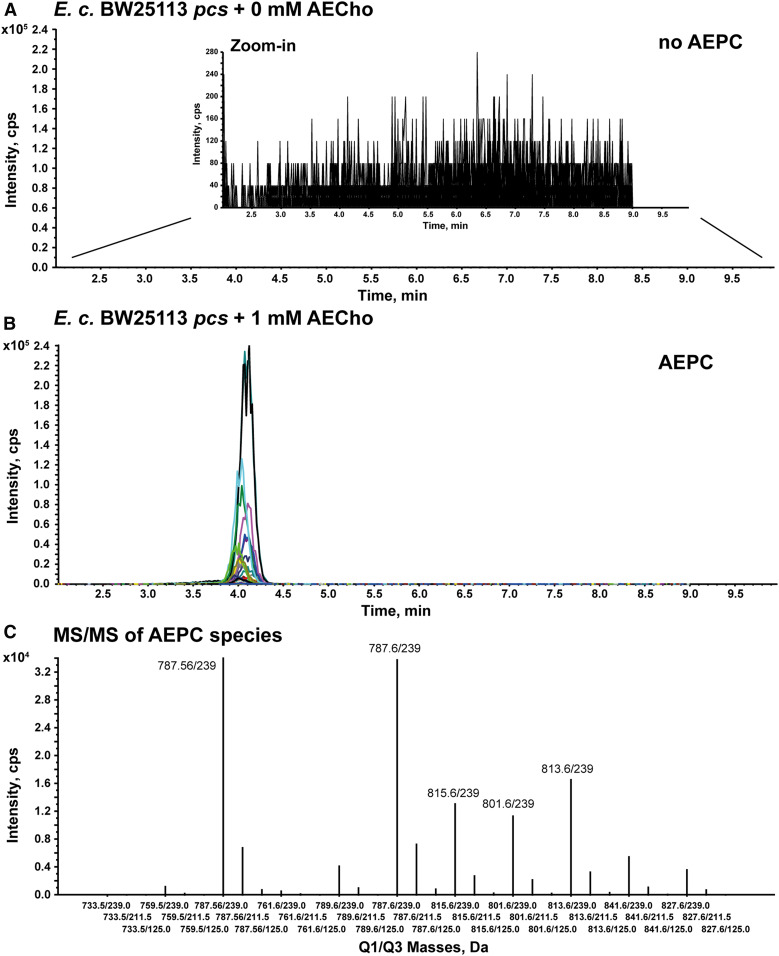
LC/MS/MS analysis of total lipids obtained from E. coli BW25113 pcs grown in the presence of AECho confirms the production of AEPC. Chromatograms from the LC/MS/MS analysis of total lipids from E. coli BW25113 pcs grown in M9 without AECho (A) and supplemented with 1 mM AECho (B). A zoom-in was used for panel A to highlight the absence of AEPC signal in the absence of AECho. The extracted ion currents for the AEPC MRM transitions are each plotted in a different color. The elution times overlap for all AEPC MRM transitions. Rhamnose (0.2%) was used in the medium to induce Pcs expression. C: MRM line plot of the various AEPC peaks observed in panel B showing the relative abundance of the parent ions and consistent relative yields for the transitions to m/z 239, m/z 125, and m/z 211 (supplemental Fig. S4D) for all species. The data shown are representative of two independent experiments.

