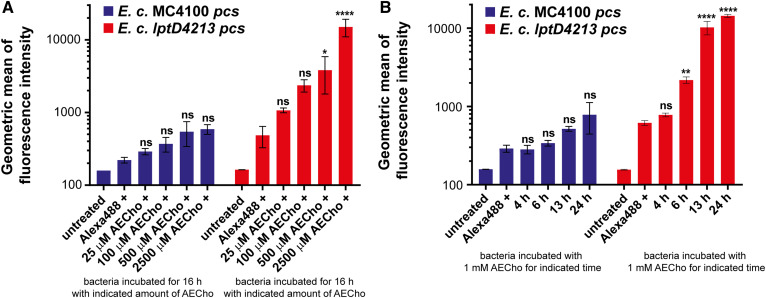
Fig. 8.
Flow cytometry analysis of E. coli MC4100 pcs and E. coli lptD4213 pcs grown with AECho and treated with Alexa488-sDIBO. A: Comparison of the geometric means of the fluorescence intensities of MC4100 pcs (blue) and lptD4213 pcs (red) samples grown for 16 h with different concentrations of AECho (0–2.5 mM AECho) followed by treatment with Alexa488-sDIBO. B: Comparison of the geometric means of the fluorescence intensities of MC4100 pcs (blue) and lptD4213 pcs (red) samples grown in the presence of 1 mM AECho for different periods of time (4–24 h) followed by treatment with Alexa488-sDIBO. l-Rhamnose (0.2%) was used to induce Pcs production. Experiments were performed in biological triplicates. Error bars represent the SD from the mean. The statistical significance represents the comparison with the sample without AECho supplementation as determined via two-way ANOVA (*P ≤ 0.05, **P ≤ 0.01, ****P ≤ 0.0001).

