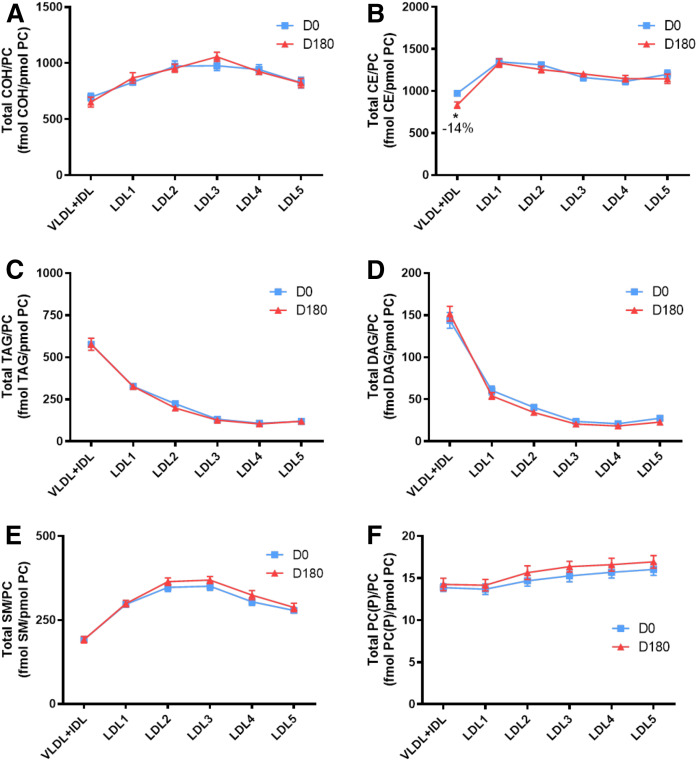
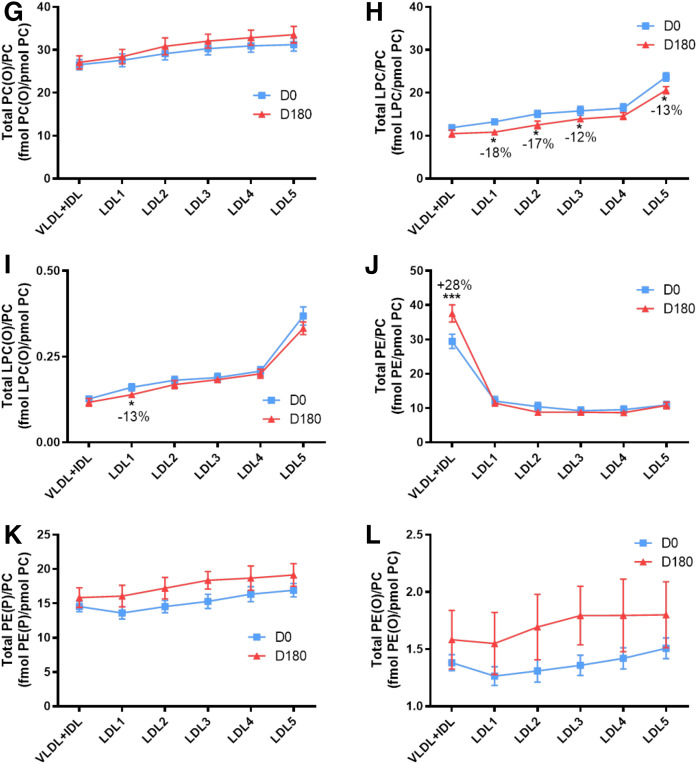
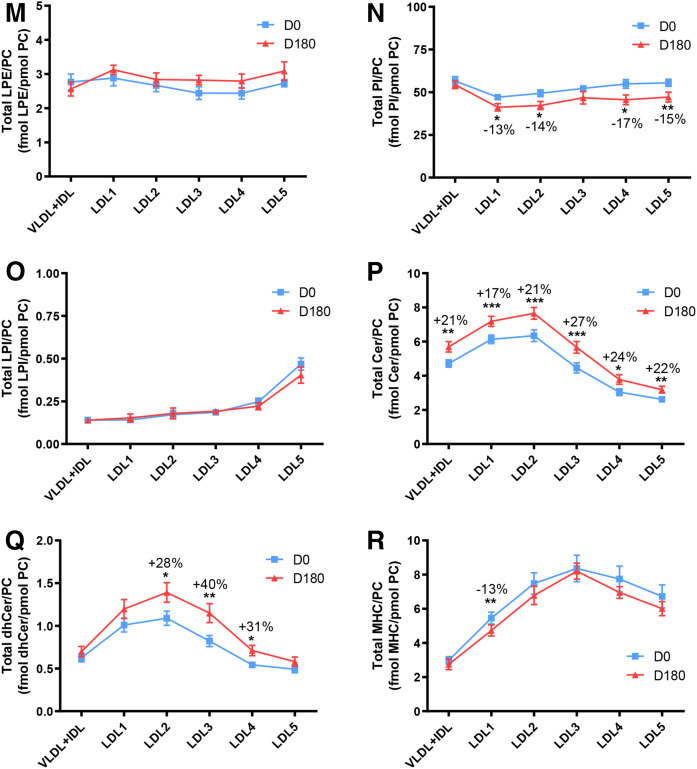
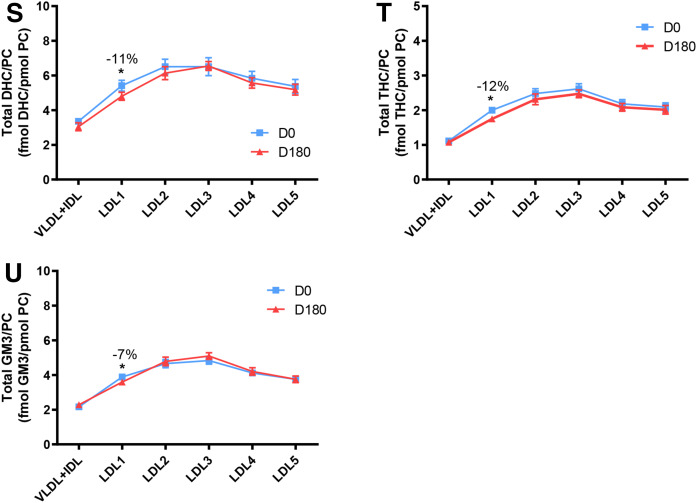
Fig. 3.
Molar ratios of individual lipid classes normalized to moles of PC in VLDL+IDL, LDL1, LDL2, LDL3, LDL4, and LDL5 subfractions from obese mixed dyslipidemic male MetS subjects at baseline (D0) and after pitavastatin calcium treatment [4 mg/day for 180 days (D180)]. Values are expressed as mean ± SEM (n = 12) in femtomoles of lipid class per picomole of PC. Percent change (%) was calculated relative to baseline values (D0). ***P < 0.001; **0.001 < P < 0.01; and *0.01;<;P < 0.05 versus D0. Density ranges: VLDL+IDL <1.019 g/ml, LDL1 = 1.019–1.023 g/ml, LDL2 = 1.023–1.029 g/ml, LDL3 = 1.029–1.039 g/ml, LDL4 = 1.039–1.050 g/ml, and LDL5 = 1.050–1.063 g/ml. A–U: COH (A); CE (B); TAG (C); DAG (D); SM (E); PC(P) (plasmalogen) (F); PC(O) (G); LPC (H); LPC(O), lysoalkylphosphtidylcholine (I); PE (J); PE(P) (plasmalogen) (K); PE(O) (L); LPE (M); PI (N); LPI (O); Cer (P); dhCer (Q); MHC (R); DHC (S); THC (T); GM3 (U).


