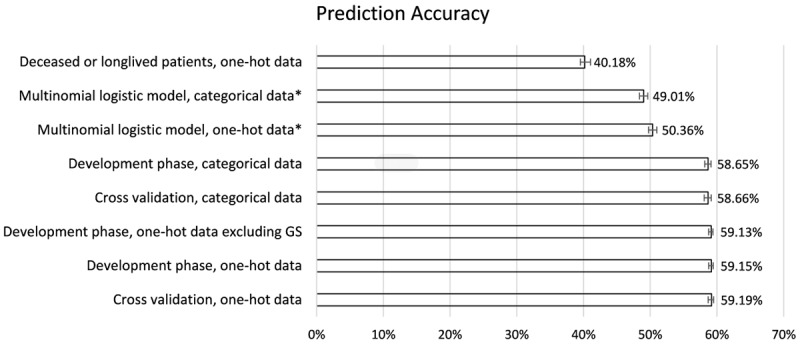
Figure 3.

Summary of prediction accuracies by model and data type. In the tuning process and sensitivity analyses, we computed the validation accuracy of each random forest model (n=240), and chose the one with the best accuracy as the final model. The error bars show 95% confidence intervals of prediction accuracies in those models and data types during tuning process, except 3 models, whose 95% confidence intervals were calculated for the accuracy of a single binomial model (indicated by *). One-hot indicates one-hot encoding of the data; balanced set refers to the sensitivity analysis with training and testing sets that had balanced distribution of all variables.
