
Figure 2. PET/CT imaging of autologous 89Zr-oxine-labeled NK-cells enables visualization and quantitation of NK-cell trafficking after adoptive-transfer.
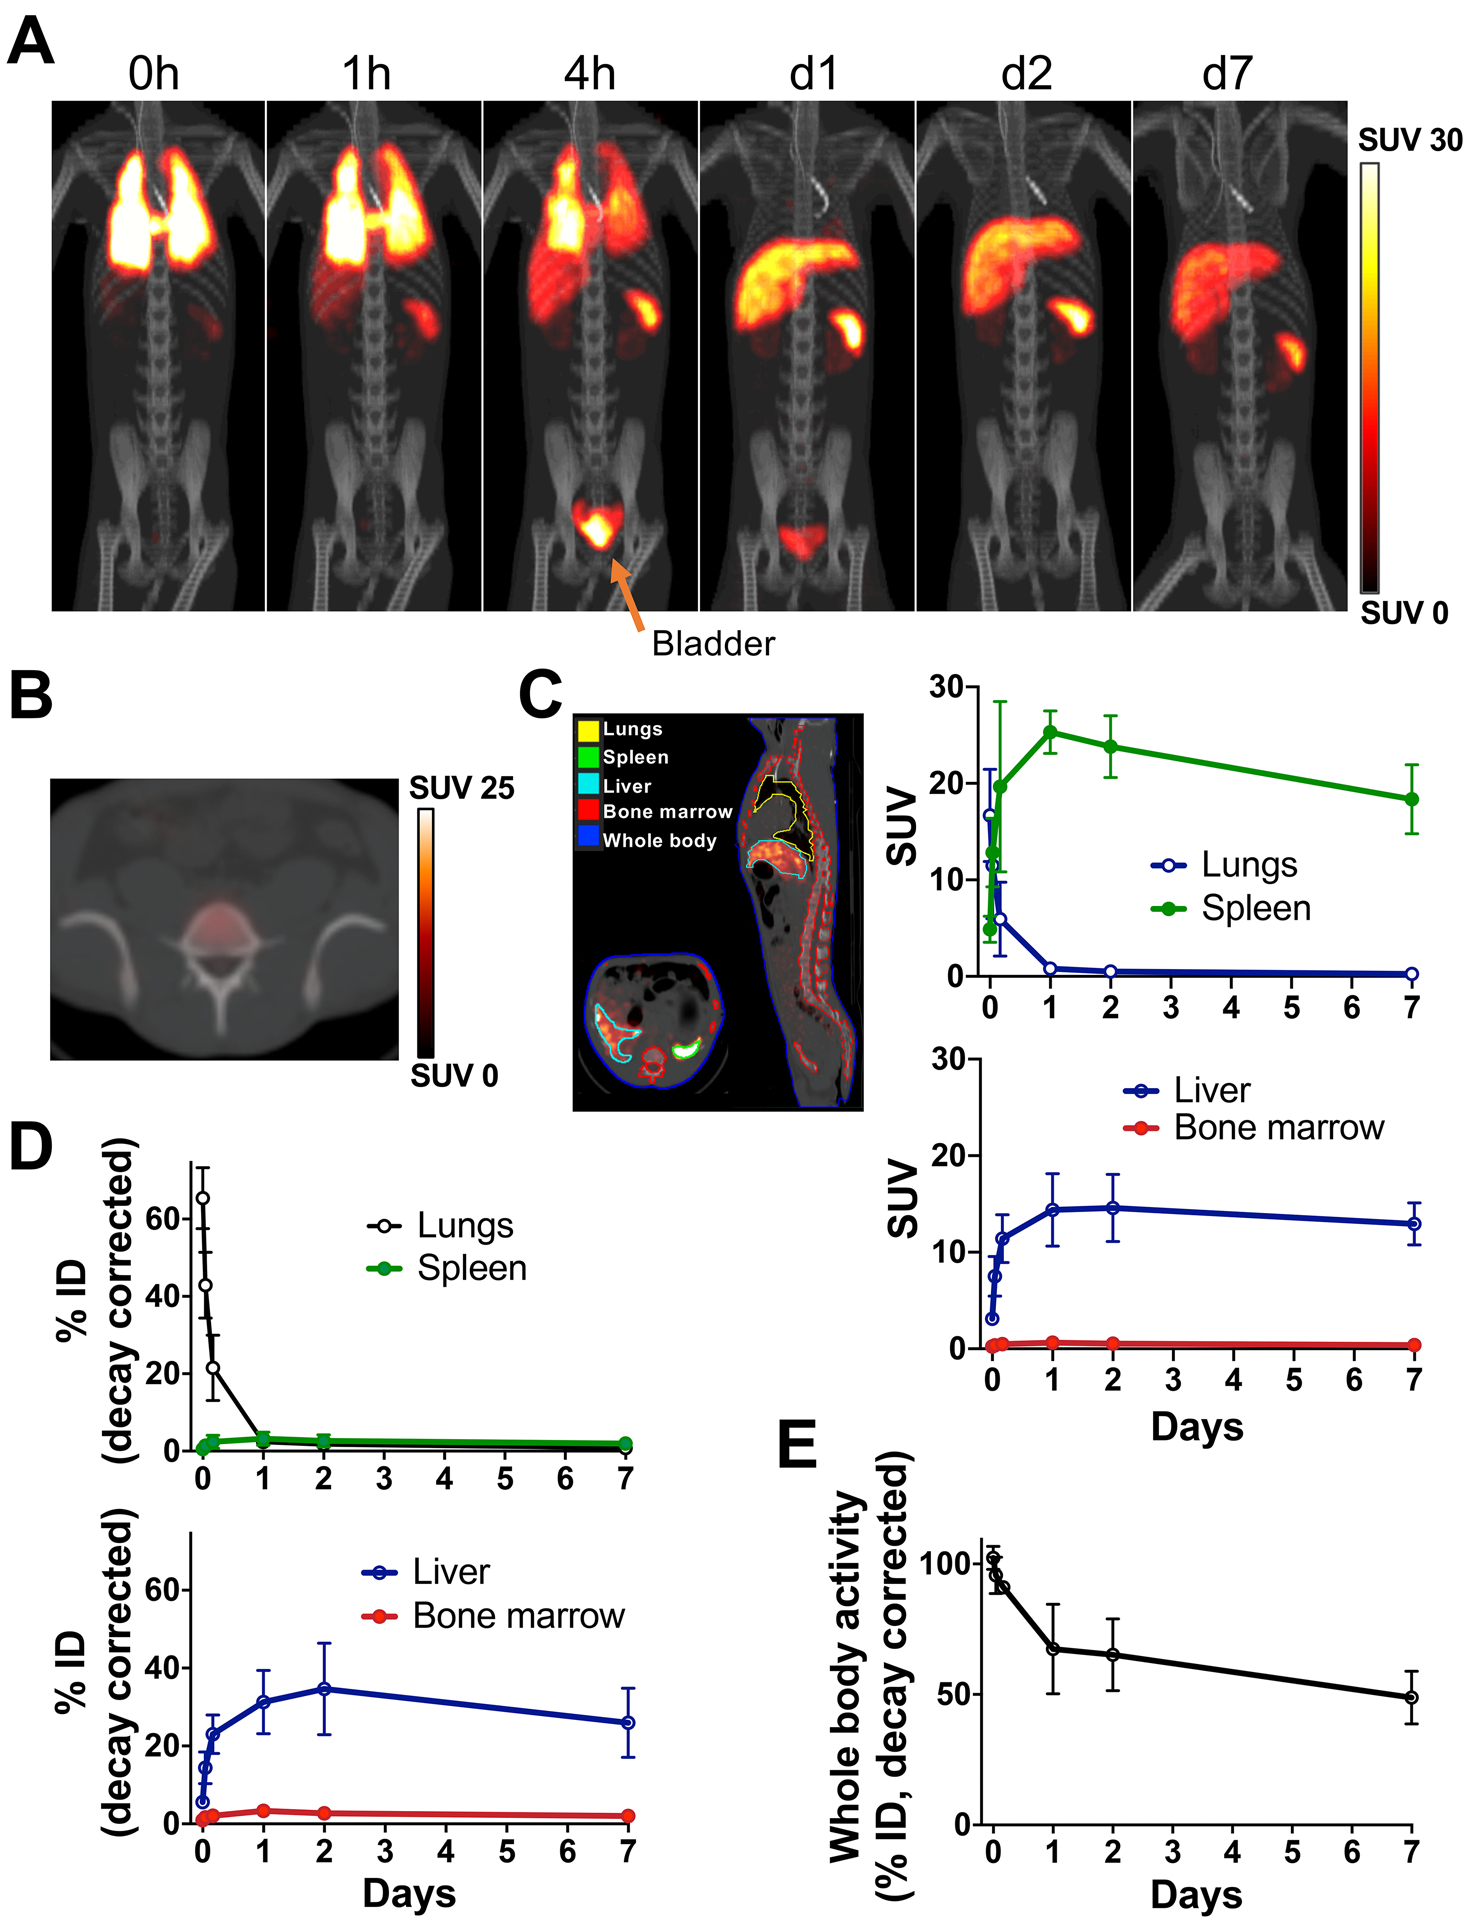
A. Autologous 89Zr-labeled expanded NK-cells transferred to RMs were tracked by PET/CT imaging, with continuous deferoxamine infusion, for up to 7 days (n=3, 2.05 ± 0.7 MBq, 13.7± 5.2 kBq/106 cells, 23.5 ± 2.0×10⁶ cells/kg, representative set of images). B. Axial PET/CT image of mid-4th lumber spine on day 1 showed minimal homing of NK-cells to the BM area of the spinal body. C. Kinetics of SUV values (right) obtained from images by drawing the contours on the organs (left) suggested that 89Zr-labeled NK-cells migrated from the lungs to the liver and spleen. See Supplementary Fig. S2A for magnification of early time points. D. % ID curves indicated that most cells were in the liver while homing to the BM was limited. Also see Supplementary Fig. S2B. E. Whole-body activity declined over time, indicating death of transferred 89Zr-labeled cells and subsequent 89Zr excretion from the body.