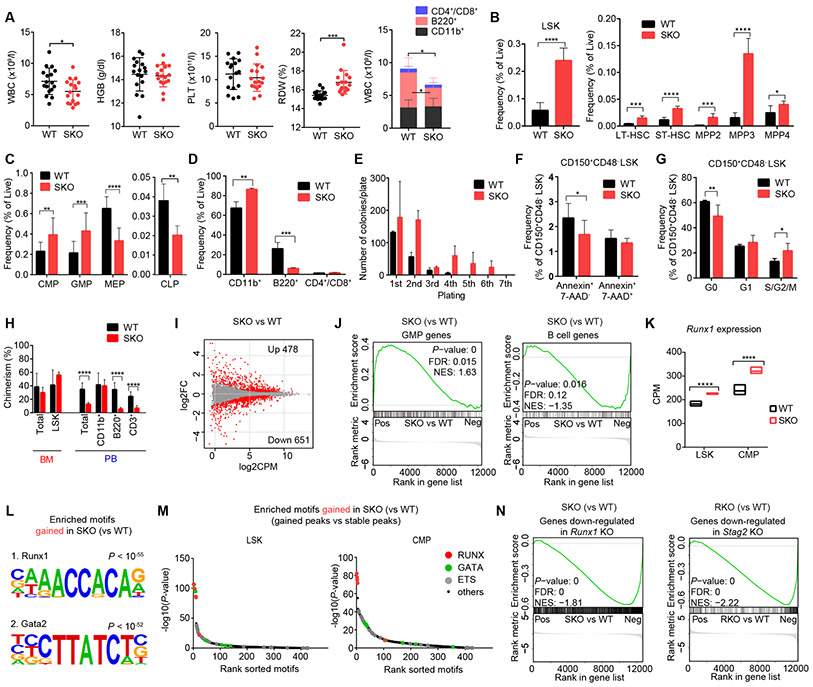
Figure 2. Stag2 depletion alters HSC self-renewal and differentiation in mice.
A, White blood cell (WBC) count, hemoglobin (HGB) level, platelet (PLT) count and red cell distribution width (RDW) in the peripheral blood (PB) of wild-type (WT) and Stag2 conditional knockout (SKO) littermate male mice are plotted as dots (n = 17), in which the mean ± standard deviation (SD) are indicated as bars (left panels). Number of granulocytes/monocytes (CD11b+), B-lymphocytes (B220+) and T-lymphocytes (CD4+/CD8+) in the PB of WT and SKO mice (mean ± SD, n = 10) are shown in the right panel. B, Frequency of lineage (Lin)-negative/Sca1+/c-Kit+ (LSK) cells (left panel), and frequencies of long-term HSC (LT-HSC), short-time HSC (ST-HSC), multipotent progenitor (MPP)-2, MPP-3, and MPP-4 fractions in the BM of WT or SKO mice (mean ± SD, n = 6) (right panel) are shown. C, Frequencies of common myeloid progenitors (CMPs), granulocyte-macrophage progenitors (GMPs), megakaryocyte/erythrocyte lineage-restricted progenitors (MEPs) and common lymphoid progenitors (CLPs) in the BM of WT and SKO mice (mean ± SD, n = 6). D, Frequencies of each lineage-committed cells in the BM of WT and SKO mice (mean ± SD, n = 4). E, Colony counts in methylcellulose replating experiments using nucleated BM cells from WT or SKO mice (mean ± SD, n = 2) are shown. BM cells were plated in duplicate at a density of 20,000 cells/plate for the first plating and 10,000 cells/plate for replating. F, Frequency of apoptotic cells (Annexin+/7-AAD−) in CD150+/CD48− LSK cells (n = 6, mean ± SD). G, Frequency of cycling cells (S/G2/M; Ki-67+/Hoechst+), quiescent cells (G0; Ki-67-/Hoechst-), and G1 cells (Ki-67+/Hoechst−) in CD150+/CD48− LSK cells (n = 5, mean ± SD). H, Percentages of CD45.2+ donor cells within each fraction of the BM or PB after competitive BM transplantation (16 weeks after pIpC injection) are shown (mean ± SD, n = 10 for WT and 6 for SKO). I, MA plot showing the transcriptional changes between WT- and SKO-derived LSK cells. Differentially expressed genes (DEGs) (FDR < 0.05) are indicated by red color. FC, fold-change. J, Gene set enrichment analysis (GSEA) between WT- and SKO-derived LSK cells, showing a significant enrichment of genes characteristic of GMPs and B-lymphocytes. Nominal P-value, false discovery rate (FDR), and normalized enrichment score (NES) are indicated. K, Expression levels of Runx1 in LSK and CMP fractions are indicated by counts per million mapped reads (CPM) (min to max values with mean, n = 3). P-values were calculated using edgeR package in R software. L, Motifs and corresponding P-values identified by de novo motif search in ATAC-seq peaks that gained accessibility in SKO-derived LSK cells. M, Enrichment of known transcription factor (TF) motifs in ATAC-seq peaks that gained accessibility in SKO-derived LSK (left panel) and CMP cells (right panel). The sorted motif rank and −log10(P-value) of a motif enrichment test using stable peaks as backgrounds is indicated in horizontal and vertical axis, respectively. N, GSEA analysis between SKO- and WT-derived LSK cells, showing a negative enrichment of genes down-regulated in Runx1 conditional knockout (RKO)-derived LSK cells compared with WT (left panel), and GSEA analysis between RKO- and WT-derived LSK cells, showing a negative enrichment of genes down-regulated in SKO-derived LSK cells compared with WT (right panel). For panels (A-G), mice were analyzed at 12-24 weeks of age. * P < 0.05; ** P < 0.01; *** P < 0.001; **** P < 0.0001. Two-tailed unpaired Student’s t-test in (A-H).

