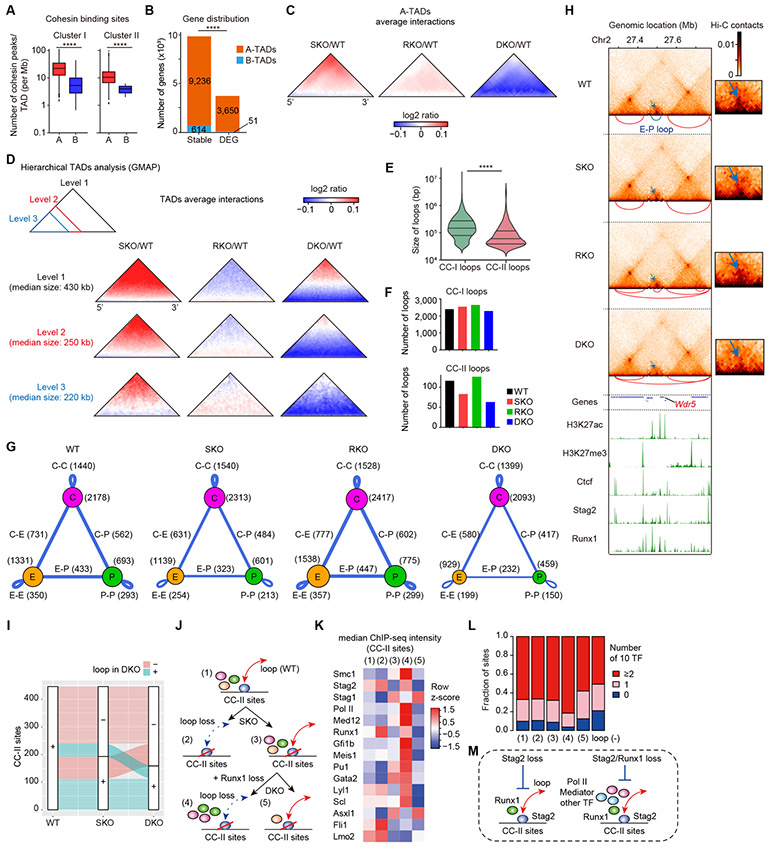
Figure 5. Stag2/Runx1 codeficiency alters chromatin architectures and disrupts enhancer-promoter loops.
A, Number of cohesin peaks (CC-I or CC-II) within topologically-associating domains (TADs) located in genomic compartment A (A-TADs) or B (B-TADs). P-values were calculated by two-sided Wilcoxon rank-sum test. B, Number of DEGs between WT- and SKO/RKO/DKO-transplanted LSK cells (FDR < 0.05) or other genes (stable) located in A- or B-TADs. P-value was calculated by Fisher’s exact test. C, Average differential changes in Hi-C contacts within a subset of size-normalized A-TADs, visualized as log2 ratio indicated in the color scale. D, Average differential changes in Hi-C contacts within each hierarchical level of size-normalized TADs, showing the disruption of short-range interactions particularly within smaller sub-TADs in SKO, and more prominent in DKO. Hierarchical TADs were called using GMAP, and each level of TADs indicated in the upper-left panel was separately analyzed. E, Violin plots showing the size distribution of CC-I or CC-II loops with median and quartiles. P-value was calculated by two-sided Wilcoxon rank-sum test. Loops were classified by the presence of only one of either CC-I or CC-II sites at their anchors. F, Number of CC-I or CC-II loops independently identified using each Hi-C data. G, Summary of the major types of loops identified in each Hi-C data. Ctcf sites (CC-I sites) and active enhancers/promoters in which loops were anchored are displayed as purple, orange, and green circles, respectively. The loops between two sites are displayed as blue lines, and the width of the lines is proportional to the number of loops relative to WT. E, Enhancer; P, Promoter; C, CTCF; C-C, Ctcf-Ctcf; C-E, Ctcf-Enhancer: C-P, Ctcf-Promoter; E-E, Enhancer-Enhancer; E-P, Enhancer-Promoter; P-P, Promoter-Promoter. H, Genome browser snapshot demonstrating the Hi-C contacts, chromatin loops (upper panels), and ChIP-seq profiles (lower panels) in WT-/SKO-/RKO-/DKO-transplanted HSPCs at the Wdr5 gene (a group IV gene in Fig. 6A) locus. The arcs below each Hi-C contact map show the loops identified in the corresponding Hi-C data, and the E-P loop anchored at both promoter of Wdr5 and active enhancer was indicated as blue color. The dotted white box indicates the magnified region shown on the right. Color scale intensities of Hi-C heatmaps are shown in KR-normalized Hi-C contacts. Note that the E-P loop anchored at both promoter of Wdr5 and active enhancer was weakened in SKO, and more prominently in DKO (blue arrows). I, An alluvial plot demonstrating the proportion of CC-II sites having loops in WT which retained or lost loops in SKO and DKO. Red sites lost loops in DKO, and green sites retained loops in DKO. J, A classification scheme of CC-II sites with loops identified in WT for the analysis in (K) and (L). K, Median ChIP-seq intensities of various factors at each group of CC-II sites shown in (J). Color scales are normalized along each row. L, Proportions of numbers of co-bound 10 TFs (Asxl1, Fli1, Gata2, Gfi1b, Lmo2, Lyl1, Meis1, Pu1, Runx1, and Scl) at each group of CC-II sites shown in (J). M, Schematic representation depicting the characteristics of loops susceptible to Stag2/Runx1 loss. **** P < 0.0001.

