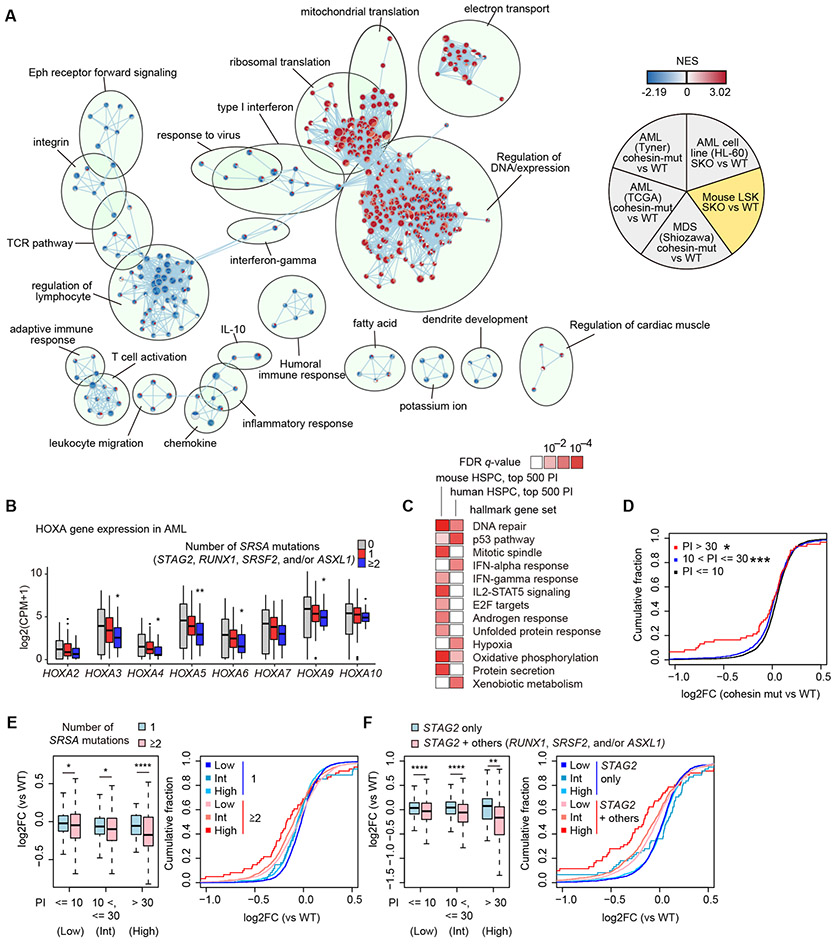
Figure 7. Shared transcriptome changes in human and mice.
A, Comparison of transcriptome changes in mouse model, three human MDS/AML, and HL-60 cell line datasets using enrichment map analysis based on GSEA results. NES values in cohesin-mutated MDS/AML cases compared with cohesin-WT cases in three independent cohort (6,33,34) are indicated in the upper left, lower left, and bottom of each circle, and those in SKO of HL-60 cell lines and LSK cells compared with WT are indicated in the upper right and lower right of each circle, respectively. Each node indicates a gene set of GSEA. The size of each node indicates the number of genes in each gene set, and the color scale indicates the NES value. The width of edge indicates the overlap size of gene sets. B, Box plots showing expression levels of HOXA family genes in human AML patients with 0/1/≥2 mutations in SRSA genes. P-values (vs no mutations in SRSA genes) were calculated with edgeR package. C, MSigDB overlap analysis between high-pausing genes and hallmark gene sets in MSigDB. FDR q-values were from MSigDB overlap analysis. Pathways which are significant (q < 0.01) in either dataset are shown. D, Cumulative probability distributions of expression changes (log2FC) of genes grouped by pausing index (PI) in cohesin-mutated cases (vs WT) in RNA-seq datasets of AML (33). P-values (vs genes with PI no more than 10) were calculated by one-sided Wilcoxon rank-sum test. E-F, Left panels: Box plots showing expression changes (log2FC) of genes grouped by PI according to the number of SRSA mutations (0/1/≥2) (E) or mutations in STAG2 with/without the other SRSA mutations (RUNX1, SRSF2, and/or ASXL1) (F) in RNA-seq datasets of AML (33). Right panels show cumulative probability distribution of expression changes (log2FC) shown in left panels. P-values were calculated by one-sided Wilcoxon rank-sum test. * P < 0.05; ** P < 0.01; *** P < 0.001; **** P < 0.0001.

