

Abstract
Background:
Recent studies have reported substantial increases in cancer incidence in young adults under 40 years in the US.
Methods:
We applied hierarchical cluster analysis to identify cancer anatomical clustering, for 48 anatomic sites, using incidence trends since 1973 for 25-39 year-olds.
Results:
Temporal trends mapped to three major clusters in men involving six organ systems (digestive, endocrine, urinary, blood, respiratory, and male genital) and one cluster in women involving five systems (digestive, endocrine, urinary, and female genital). For both men and women, kidney, thyroid, and colorectal cancers consistently clustered for all ages 25-39 and for each 5-year age subgroup. Further, several cancers linked to the endocrine and digestive systems (three in men and six in women) had highly consistent temporal incidence trends.
Conclusions:
These findings suggest there may be organ system connections for cancers of the endocrine and digestive systems; etiologic approaches focused on clusters of cancers rather than individual cancers may prove fruitful.
INTRODUCTION
Our recent work along with others has identified substantial increases in incidence for many cancers in adults under 40 years in the US.1,2 However, it remains unclear what etiologic factors drive these increases. Given that carcinogenesis evolves many systemic processes, as described by Hanahan and Weinberg,3 analyzing the temporal trends of different cancers to identify clusters sharing similar trends and common functional systems--such as digestive, endocrine, urinary, and sex-specific genital cancers--may reveal systemic connections and common risk factors for cancers within the identified clusters. To examine such potential cancer clusters and systemic connections, here we apply hierarchical cluster analysis to identify cancer clusters for all 48 anatomic sites recorded in the Surveillance Epidemiology and End Results (SEER) Program,4 for young adults under 40 years.
METHODS
We computed annual incidence rates from 1973 to 2015 for the 48 anatomic sites as grouped and recorded in the SEER Program4 for 25- to 39-year-old men and women, separately. We included all malignant cases (N=421,062) reported in SEER 9 (1973-1991), SEER 13 (1992-1999) and SEER 18 (2000-2015) registries, and age-standardized all incidence rates to the 2000 US population (we refer to these data as the Combined SEER hereafter). We applied hierarchical cluster analysis5 to identify clusters. Hierarchical cluster analysis is a statistical method designed to identify elements in a set with the highest similarity and group them iteratively until all elements are sorted and organized into a hierarchy of clusters based on similarity. The resulting clusters are commonly presented in a dendrogram. Here we first computed the Pearson correlation (r) between the incidence time series from 1973 to 2015 for each pair of cancers and used it as a proxy of similarity and grouped cancers with a correlation greater than 0.6 in the same cluster.
As a sensitivity analysis, we performed the same analysis using only data from SEER 9, which is comprised of the nine original cancer registries with records for all years during our study period (1973-2015), to examine whether any of the results we observed in the Combined SEER were related to differences from the additional registries based on demographic and other differences across the newer cancer registries. In a second sensitivity analysis, we divided the full range of 25-39 years of age in the Combined SEER into three 5-year age subgroups (i.e., 25-29, 30-34, and 35-39 years) and performed the same hierarchical cluster analysis for each age group. As in the Combined SEER analysis, we performed both sensitivity analyses for men and women, separately.
All data used here are publicly available and deidentified, so this study was exempt from ethical review and informed consent according to Code of Federal Regulations (45 CFR 46.101(b)). All data processing and analyses were done using R (https://www.r-project.org); for all hierarchical cluster analyses, we used the “hclust” function in R and the “average” method in the function. Model code to perform the analyses is available from the author’s Github site (https://github.com/wan-yang/cancer_clusters).
RESULTS
For 25- to 39-year-old men, we identified three clusters involving six systems (Figure 1 and eFigure 1 for the dendrogram including all cancers). The first cluster included five cancers: kidney (and renal pelvis), thyroid, colorectal, leukemia, and other endocrine including thymus; the first three sites had the highest correlations (all r>0.85; Figure 1B, top panel). Incidence rates of cancers within this cluster (Figure 1A, top panel) closely track and have been increasing in the last two decades. The second cluster (Figure 1, middle panel) included three cancers: lung (and bronchus), larynx, and bladder, all of which are closely linked to smoking and incidence rates have been decreasing in parallel with the decreasing smoking rates. The remaining cluster (Figure 1, bottom panel) included three cancers: testis, liver (and intrahepatic bile duct), and anus (and anal canal and anorectum); all three sites are linked to viral infections, including HIV and Epstein–Barr virus for testicular cancer,6 Hepatitis B and C viruses for liver cancer,7 and HIV and human papillomavirus for anal cancer.8
Figure 1.
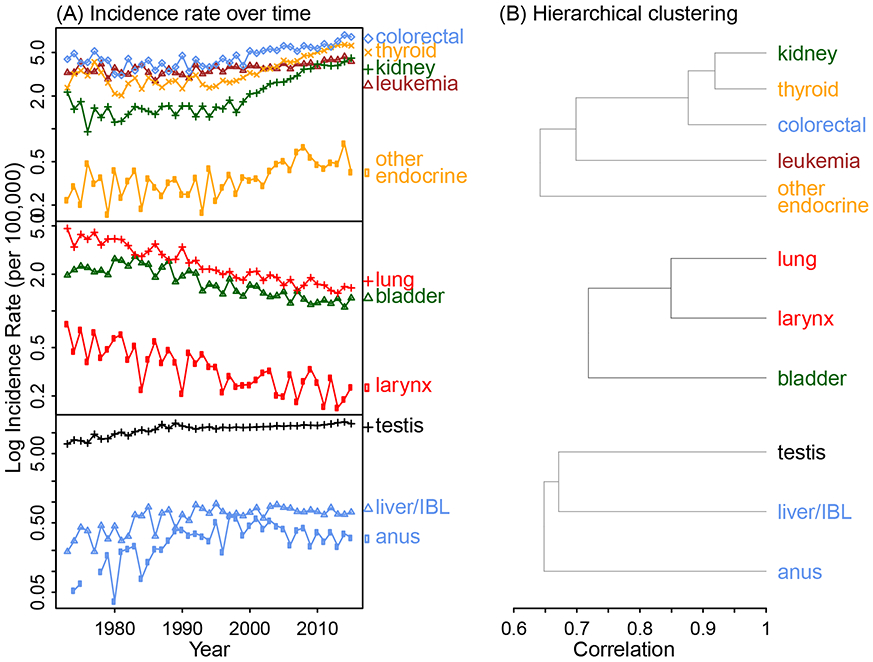
Temporal trends in cancer incidence and identified cancer clusters for 25- to 39-year-old men, using the Combined Surveillance, Epidemiology, and End Results (SEER). The cancer sites are color-coded by system (pink for breast, blue for digestive, magenta for female genital, black for male genital, brown for blood, orange for endocrine, green for urinary, red for respiratory, and grey for all other sites). The full dendrogram including all cancer types is shown in eFigure 1.
For 25- to 39-year-old women, we identified one cluster with nine cancers from five systems (Figure 2 and eFigure 2 for the full dendrogram). Within this cluster, like observed for men, increasing trends in kidney, thyroid and colorectal cancers were the most correlated (all r>0.85); further, both thyroid and other endocrine including thymus were included. However, unlike in men, in addition to colorectal, another three cancers related to the digestive system also clustered in the same group.
Figure 2.
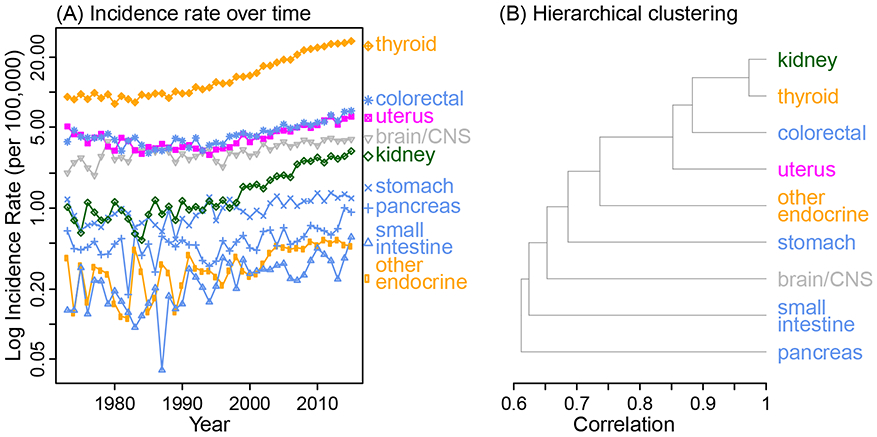
Temporal trends in cancer incidence and identified cancer clusters for 25-39 year-old women, using the Combined SEER. The cancer sites are color-coded by system as in Figure 1. The full dendrogram including all cancer types is shown in eFigure 2.
Sensitivity analysis using SEER 9 data identified cancer clusters similar to those with the Combined SEER (see eFigures 3-4 and comparison in eAppendix 1). When divided into 5-year age subgroups, due to smaller population size and lower incidence (particularly for the youngest subgroup, i.e. 25- to 29-year-olds), larger variations across years obscured the temporal trends. However, the strong correlations among kidney, thyroid, and colorectal cancers were evident for all three subgroups in both men (eFigure 5) and women (eFigure 6). Given this consistent clustering, we further conducted a joinpoint analysis (eAppendix 1) to examine whether the patterns in cancer incidence were similar by sex and mapped to trends in medical imaging use. Joinpoint analysis showed different rate change points for men and women, for all three cancer types (eFigure 7).
DISCUSSION
Overall, we found that the temporal trends in kidney, thyroid, and colorectal cancer incidence are highly correlated (>85%) for both young men and women aged 25-39 years. Further, we found that these similar trends are unlikely to be due to the trend in use of medical imaging, especially computed tomography (CT), which has increased since the 1980s9 and has been cited as a reason behind the recent increases in both young adult kidney cancer10 and thyroid cancer.11 We base this conclusion on the fact that we did not find rate change points in cancer trends to be similar among men and women, whereas the trends in CT use are similar among men and women.12 In addition, for the same age group, we found clustering of several cancers primarily linked to the endocrine and digestive systems. These highly consistent temporal trends in cancer incidence and clustering by functional system suggest systemic connections for the identified cancers, potentially through common cancer drivers or systemic disruptions linked to carcinogenesis.
Common environmental and lifestyle exposures, in particular those likely to be linked with systemic disruptions, may explain the observed strong correlations. For instance, obesity has been associated with a number of cancers identified here, including kidney, thyroid, colorectal, pancreas, and uterus13 and shown to alter metabolism and tissue microenvironment.14 Further, for kidney, thyroid, and colorectal cancer, the strong correlations in incidence trends are evident overall and in 5-year age groups between 25-39 years including the youngest subgroup (i.e. 25-29 year-olds). This consistency in temporal patterns as well as the long induction time for many solid tumors suggests that risk factors may operate early in life, at least for these three cancers. Consistently, studies have also shown that obesity has its roots early in life.15,16
It is also likely that there are junction points key to multiple organs, disruption of which may facilitate cancer development in any of the affected organs. For instance, the thyroid could be such a junction point. Studies have associated thyroid dysfunction with elevated risk of colorectal cancer and long-term thyroid hormone replacement with decreased risk of colorectal cancer.17 Studies have also shown interactions between thyroid and kidney diseases.18 Such interactions across the thyroid, colon–rectum, and kidney, potentially via the thyroid, may explain the strong correlations in temporal incidence trends for the three cancers. As such, further studies are needed to investigate the impact of thyroid function (or dysfunction) on related cancers. Similar systemic connections may exist in different functional systems (e.g. the endocrine system and digestive systems represented in the identified clusters here) and warrant further investigation.
Our study suffers from the common limitations of association studies. The hierarchical cluster analysis used here is based on correlation of incidence trends; however, it is a useful starting point in developing experimental and epidemiological studies to robustly establish causation. In addition, our method is limited in identifying clusters of cancers with very low incidence rates. For example, a cancer cluster related to smoking (i.e. lung, larynx, and bladder) was identified for men (Figure 1) but not for women, despite the common etiology. This is likely due to the low and fluctuating incidence rates of these cancers in young women (in particular, for larynx cancer; see eFigure 8); as a result, incidence trends in these cancers did not show a similarity high enough to be included in a cluster. Similarly, our method could have missed other cancers related to the identified clusters (e.g., other smoking-related cancers) and/or other clusters entirely.
Increasingly, therapeutic approaches to cancer treatment and control are recognizing the importance of identifying treatments based on the key pathways and mechanisms involving multiple hallmarks of cancer rather than specific treatment by cancer site.3 Consistently, our findings suggest there are likely common drivers and systemic connections for cancers of the endocrine and digestive systems and that studies that focus on the mechanisms underlying the clusters of cancers rather than individual cancers may be a fruitful approach to understanding the etiology.
Supplementary Material
eFigure 1. Dendrogram from the hierarchical cluster analysis including all cancers for 25-39 year-old men, using the Combined SEER. The cancer sites are color-coded by system as in Figure 1 (i.e., pink for breast, blue for digestive, magenta for female genital, black for male genital, brown for blood, orange for endocrine, green for urinary, red for respiratory, and grey for all other sites). Brown boxes show the identified clusters (with more than 2 cancers) based on a correlation r > 0.6 as reported in Figure 1.
eFigure 2. Dendrogram from the hierarchical cluster analysis including all cancers for 25-39 year-old women, using the Combined SEER. The cancer sites are color-coded by system as in Figure 1 (i.e., pink for breast, blue for digestive, magenta for female genital, black for male genital, brown for blood, orange for endocrine, green for urinary, red for respiratory, and grey for all other sites). The brown box shows the identified cluster (with more than 2 cancers) based on a correlation r > 0.6 as reported in Figure 2.
eFigure 3. Dendrogram from the hierarchical cluster analysis including all cancers for 25-39 year-old men, using SEER 9 data only (vs. using the Combined SEER data in Figure 1). The cancer sites are color-coded by system as in Figure 1 (i.e., pink for breast, blue for digestive, magenta for female genital, black for male genital, brown for blood, orange for endocrine, green for urinary, red for respiratory, and grey for all other sites). Brown boxes show the identified clusters (with more than 2 cancers) based on a correlation r > 0.6.
eFigure 4. Dendrogram from the hierarchical cluster analysis including all cancers for 25-39 year-old women, using SEER 9 data only (vs. using the Combined SEER data in Figure 2). The cancer sites are color-coded by system as in Figure 1 (i.e., pink for breast, blue for digestive, magenta for female genital, black for male genital, brown for blood, orange for endocrine, green for urinary, red for respiratory, and grey for all other sites). Brown boxes show the identified clusters (with more than 2 cancers) based on a correlation r > 0.6.
eFigure 5. Sensitivity analysis with 5-year age subgroups for men, using the Combined SEER. The cancer sites are color-coded by system as in Figure 1 (i.e., pink for breast, blue for digestive, magenta for female genital, black for male genital, brown for blood, orange for endocrine, green for urinary, red for respiratory, and grey for all other sites). Note that, for 25-29 year-olds, the correlation between kidney cancer and the cluster of thyroid and colorectal cancer is 0.59 (i.e., slightly lower than the 0.6 cut-off). Gaps in the time series for prostate cancer among 34-39 year-olds (E) are zeros and thus have no logarithms.
eFigure 6. Sensitivity analysis with 5-year age subgroups for women, using the Combined SEER. The cancer sites are color-coded by system as in Figure 1 (i.e., pink for breast, blue for digestive, magenta for female genital, black for male genital, brown for blood, orange for endocrine, green for urinary, red for respiratory, and grey for all other sites).
eFigure 7. Rate change points for colorectal, kidney, and thyroid cancer, among 25-39 year-old men and women, respectively, identified by joinpoint analysis. 'x's show age-standardized annual incidence rates during 1973-2015, based on the Combined SEER data; green lines show fitted trends and surrounding grey areas show the 95% confidence intervals (CIs). Vertical dashed lines show identified rate change points and texts in the plots show the mean annual percent changes (APC) and 95% CIs (in parentheses) for the listed periods divided by the rate change points.
eFigure 8. Comparison of temporal incidence trends in lung, larynx, and bladder cancer among 25-39 year-old men (A) and women (B). The annual incidence rates are computed based on the Combined SEER data and age-standardized to the 2000 US population.
Acknowledgments
Funding: WY was partly supported by NIH/NIEHS grant ES009089; MBT was supported by NIH/NCI grants 2U01CA164920 and P30CA013696 and the Breast Cancer Research Foundation. This study was also supported by the Data Science Institute and Irving Institute for Cancer Dynamics Seed Funds Program at Columbia University.
Footnotes
Data availability: All data used here are publically available from the Surveillance, Epidemiology, and End Results (SEER) Program (https://seer.cancer.gov). Model code to perform the analyses is available from the author’s Github site (https://github.com/wan-yang/cancer_clusters).
Conflict of Interest: The authors have no conflicts of interest to disclose.
Contributor Information
Wan Yang, Department of Epidemiology, Mailman School of Public Health, Columbia University, New York, NY.
Mary Beth Terry, Department of Epidemiology, Mailman School of Public Health, Columbia University, New York, NY; Herbert Irving Comprehensive Cancer Center, Columbia University Medical Center, New York, NY.
References:
- 1.Kehm RD, Yang W, Tehranifar P, et al. 40 Years of Change in Age- and Stage-Specific Cancer Incidence Rates in US Women and Men. JNCI Cancer Spectr 2019;3(3):pkz038. [DOI] [PMC free article] [PubMed] [Google Scholar]
- 2.Sung H, Siegel RL, Rosenberg PS, et al. Emerging cancer trends among young adults in the USA: analysis of a population-based cancer registry. Lancet Public Health 2019;4(3):E137–E147. [DOI] [PubMed] [Google Scholar]
- 3.Hanahan D, Weinberg RA. The hallmarks of cancer: Perspectives for cancer medicine In: Kerr DJ, Haller DG, van de Velde CJH, Baumann M, eds. Oxford Textbook of Oncology. 3 ed Oxford University Press, 2016. [Google Scholar]
- 4.National Cancer Institute. The Surveillance, Epidemiology, and End Results (SEER) Program. https://seer.cancer.gov.
- 5.Rousseeuw PJ, Kaufman L. Finding Groups in Data Wiley Online Library, 1990.
- 6.Garolla A, Vitagliano A, Muscianisi F, et al. Role of Viral Infections in Testicular Cancer Etiology: Evidence From a Systematic Review and Meta-Analysis. Front Endocrinol (Lausanne) 2019;10:355. [DOI] [PMC free article] [PubMed] [Google Scholar]
- 7.Ringelhan M, McKeating JA, Protzer U. Viral hepatitis and liver cancer. Philos Trans R Soc Lond B Biol Sci 2017;372(1732). [DOI] [PMC free article] [PubMed] [Google Scholar]
- 8.Nelson VM, Benson AB 3rd. Epidemiology of Anal Canal Cancer. Surg Oncol Clin N Am 2017;26(1):9–15. [DOI] [PubMed] [Google Scholar]
- 9.Brenner DJ, Hall EJ. Computed tomography—an increasing source of radiation exposure. New Engl J Med 2007;357(22):2277–2284. [DOI] [PubMed] [Google Scholar]
- 10.Nepple KG, Yang L, Grubb RL, et al. Population Based Analysis of the Increasing Incidence of Kidney Cancer in the United States: Evaluation of Age Specific Trends From 1975 to 2006. J Urology 2012;187(1):32–38. [DOI] [PubMed] [Google Scholar]
- 11.Davies L, Welch HG. Increasing incidence of thyroid cancer in the United States, 1973-2002. JAMA 2006;295(18):2164–7. [DOI] [PubMed] [Google Scholar]
- 12.Hess EP, Haas LR, Shah ND, et al. Trends in computed tomography utilization rates: a longitudinal practice-based study. J Patient Saf 2014;10(1):52–8. [DOI] [PubMed] [Google Scholar]
- 13.Lauby-Secretan B, Scoccianti C, Loomis D, et al. Body Fatness and Cancer - Viewpoint of the IARC Working Group. New Engl J Med 2016;375(8):794–798. [DOI] [PMC free article] [PubMed] [Google Scholar]
- 14.Golemis EA, Scheet P, Beck TN, et al. Molecular mechanisms of the preventable causes of cancer in the United States. Genes Dev 2018;32(13-14):868–902. [DOI] [PMC free article] [PubMed] [Google Scholar]
- 15.Ester WA, Houghton LC, Lumey LH, et al. Maternal and Early Childhood Determinants of Women's Body Size in Midlife: Overall Cohort and Sibling Analyses. American Journal of Epidemiology 2017;185(5):385–394. [DOI] [PMC free article] [PubMed] [Google Scholar]
- 16.Terry MB, Wei Y, Esserman D, et al. Pre- and postnatal determinants of childhood body size: cohort and sibling analyses. J Dev Orig Health Dis 2011;2(2):99–111. [DOI] [PubMed] [Google Scholar]
- 17.Boursi B, Haynes K, Mamtani R, et al. Thyroid dysfunction, thyroid hormone replacement and colorectal cancer risk. J Natl Cancer Inst 2015;107(6):djv084. [DOI] [PMC free article] [PubMed] [Google Scholar]
- 18.Rhee CM. The interaction between thyroid and kidney disease: an overview of the evidence. Curr Opin Endocrinol 2016;23(5):407–415. [DOI] [PMC free article] [PubMed] [Google Scholar]
Associated Data
This section collects any data citations, data availability statements, or supplementary materials included in this article.
Supplementary Materials
eFigure 1. Dendrogram from the hierarchical cluster analysis including all cancers for 25-39 year-old men, using the Combined SEER. The cancer sites are color-coded by system as in Figure 1 (i.e., pink for breast, blue for digestive, magenta for female genital, black for male genital, brown for blood, orange for endocrine, green for urinary, red for respiratory, and grey for all other sites). Brown boxes show the identified clusters (with more than 2 cancers) based on a correlation r > 0.6 as reported in Figure 1.
eFigure 2. Dendrogram from the hierarchical cluster analysis including all cancers for 25-39 year-old women, using the Combined SEER. The cancer sites are color-coded by system as in Figure 1 (i.e., pink for breast, blue for digestive, magenta for female genital, black for male genital, brown for blood, orange for endocrine, green for urinary, red for respiratory, and grey for all other sites). The brown box shows the identified cluster (with more than 2 cancers) based on a correlation r > 0.6 as reported in Figure 2.
eFigure 3. Dendrogram from the hierarchical cluster analysis including all cancers for 25-39 year-old men, using SEER 9 data only (vs. using the Combined SEER data in Figure 1). The cancer sites are color-coded by system as in Figure 1 (i.e., pink for breast, blue for digestive, magenta for female genital, black for male genital, brown for blood, orange for endocrine, green for urinary, red for respiratory, and grey for all other sites). Brown boxes show the identified clusters (with more than 2 cancers) based on a correlation r > 0.6.
eFigure 4. Dendrogram from the hierarchical cluster analysis including all cancers for 25-39 year-old women, using SEER 9 data only (vs. using the Combined SEER data in Figure 2). The cancer sites are color-coded by system as in Figure 1 (i.e., pink for breast, blue for digestive, magenta for female genital, black for male genital, brown for blood, orange for endocrine, green for urinary, red for respiratory, and grey for all other sites). Brown boxes show the identified clusters (with more than 2 cancers) based on a correlation r > 0.6.
eFigure 5. Sensitivity analysis with 5-year age subgroups for men, using the Combined SEER. The cancer sites are color-coded by system as in Figure 1 (i.e., pink for breast, blue for digestive, magenta for female genital, black for male genital, brown for blood, orange for endocrine, green for urinary, red for respiratory, and grey for all other sites). Note that, for 25-29 year-olds, the correlation between kidney cancer and the cluster of thyroid and colorectal cancer is 0.59 (i.e., slightly lower than the 0.6 cut-off). Gaps in the time series for prostate cancer among 34-39 year-olds (E) are zeros and thus have no logarithms.
eFigure 6. Sensitivity analysis with 5-year age subgroups for women, using the Combined SEER. The cancer sites are color-coded by system as in Figure 1 (i.e., pink for breast, blue for digestive, magenta for female genital, black for male genital, brown for blood, orange for endocrine, green for urinary, red for respiratory, and grey for all other sites).
eFigure 7. Rate change points for colorectal, kidney, and thyroid cancer, among 25-39 year-old men and women, respectively, identified by joinpoint analysis. 'x's show age-standardized annual incidence rates during 1973-2015, based on the Combined SEER data; green lines show fitted trends and surrounding grey areas show the 95% confidence intervals (CIs). Vertical dashed lines show identified rate change points and texts in the plots show the mean annual percent changes (APC) and 95% CIs (in parentheses) for the listed periods divided by the rate change points.
eFigure 8. Comparison of temporal incidence trends in lung, larynx, and bladder cancer among 25-39 year-old men (A) and women (B). The annual incidence rates are computed based on the Combined SEER data and age-standardized to the 2000 US population.