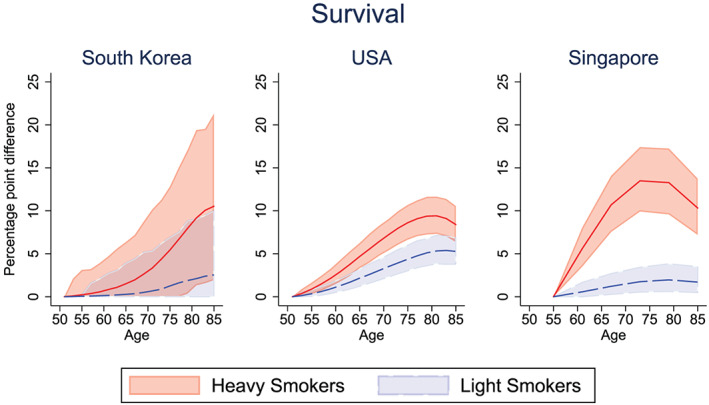
Figure 1.

Percentage point increase in survival if never smoked, for light and heavy male smokers. Solid lines (red = “heavy smokers,” blue = “light smokers) represent the mean difference in survival between pre‐ and post‐intervention. Confidence bounds represent the 95% credible interval from Monte Carlo uncertainty of 1,000 bootstrap samples [Colour figure can be viewed at wileyonlinelibrary.com]
