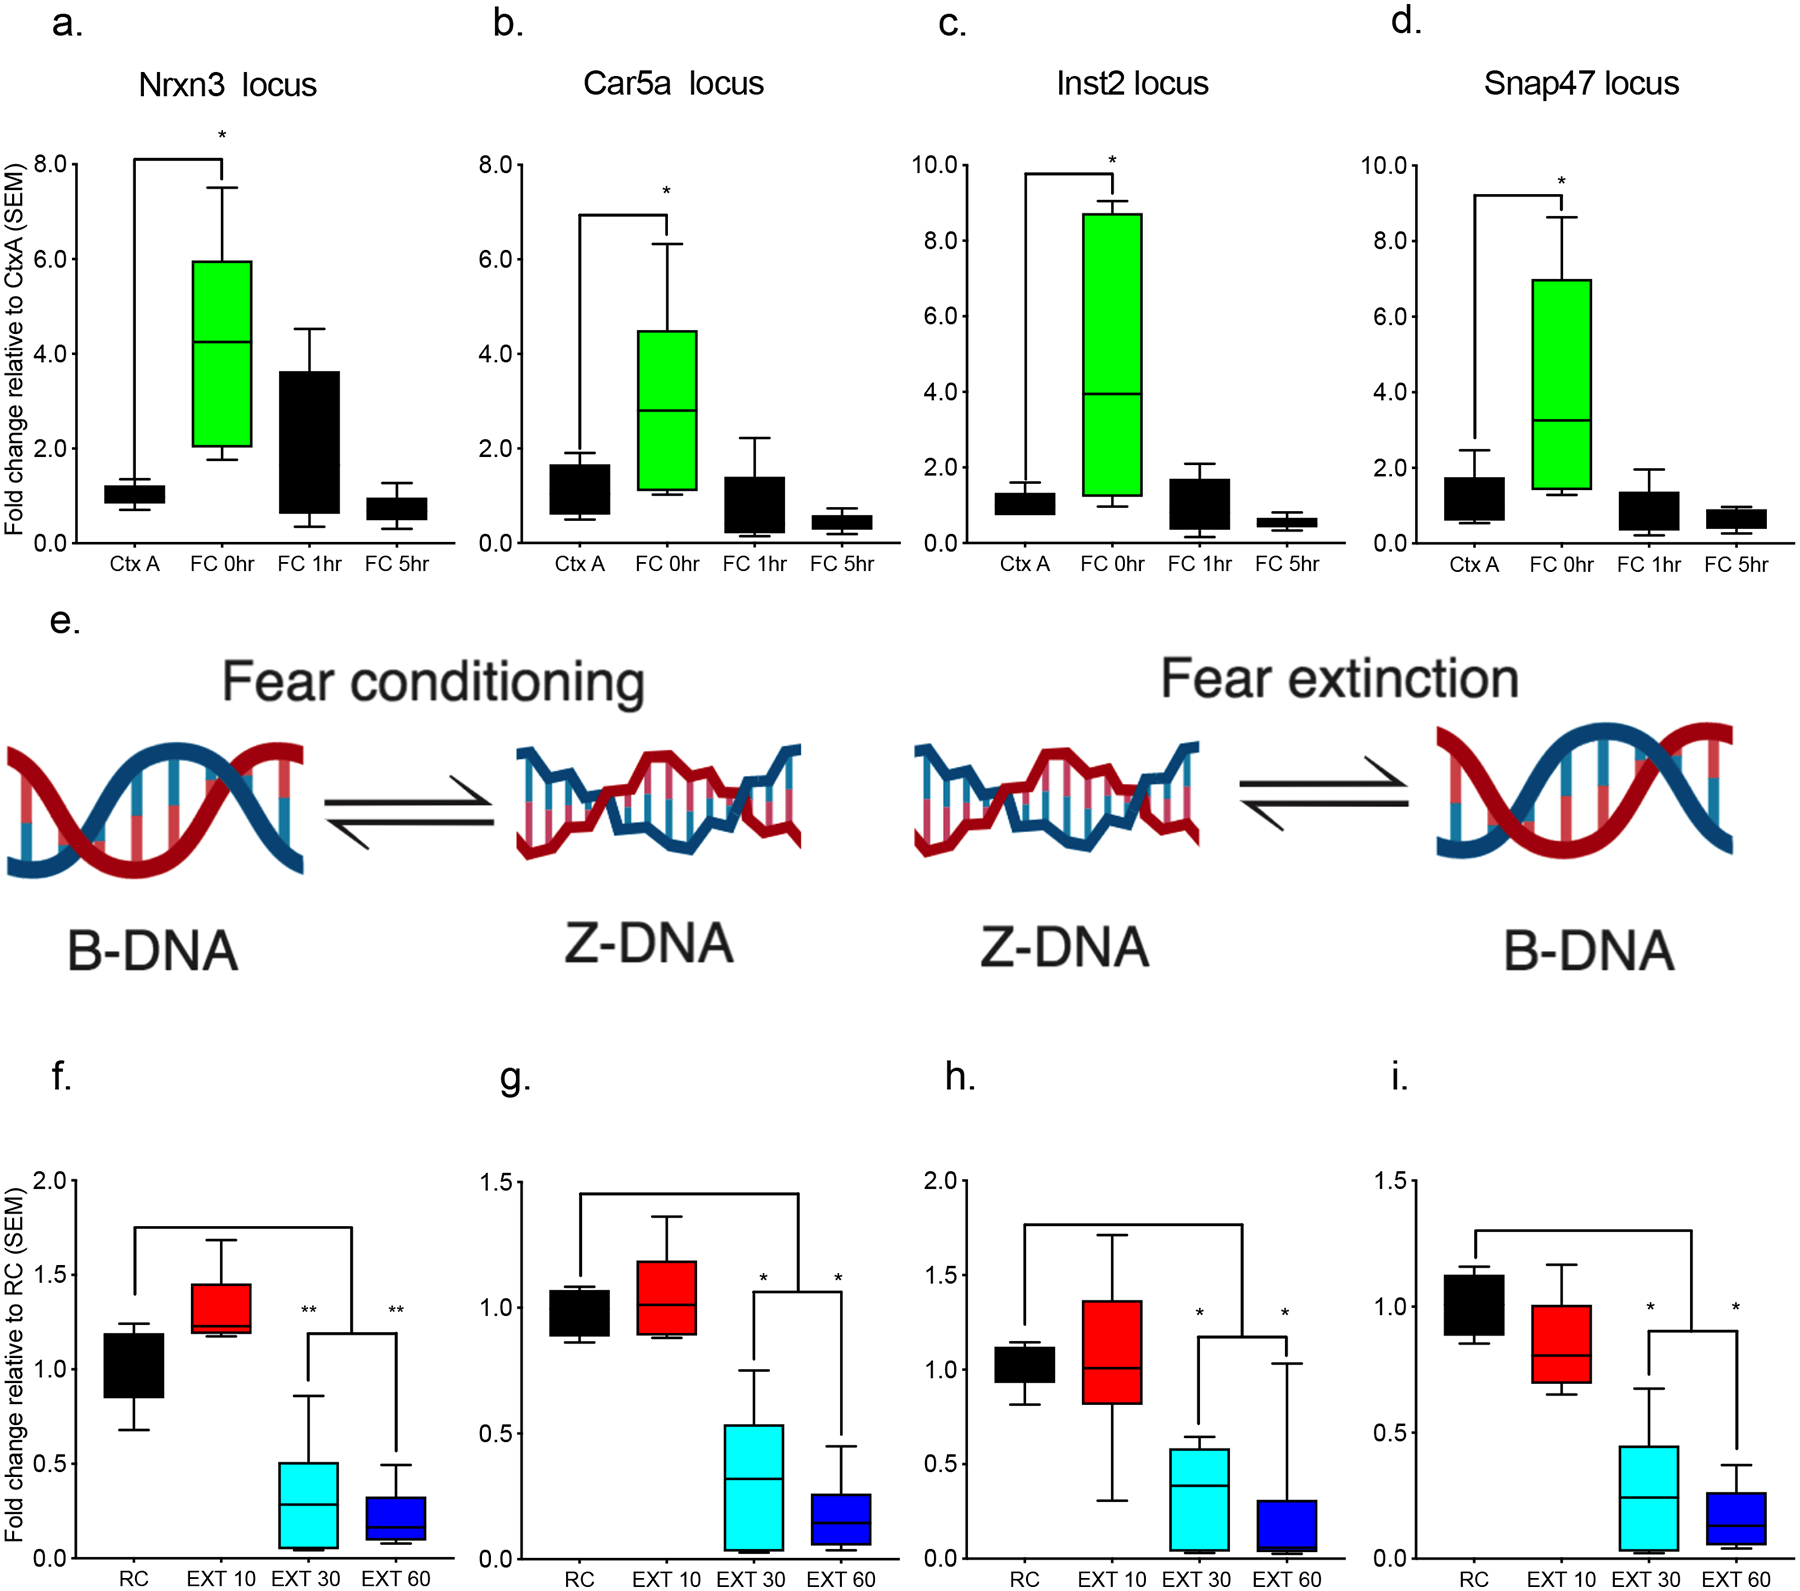
Figure 3. Z-DNA is a critical modulator of activity-dependent transcription.

Animals that were exposed to the fear conditioning context but not conditioned (Ctx A) compared to those that were fear conditioned and euthanized immediately after training (FC O h), 1 h after (FC 1h), or 5 h after (FC 5h) exhibited significantly increased Z-DNA at the a, Nrxn3 locus (n = 5–6 animals per group from a single cohort, ANOVA, F3,18 = 5.983, *p<0.01 Dunnett’s posthoc tests: Ctx A vs FC 0h p = 0.0083, Ctx A vs FC 1h p = 0.4994, Ctx A vs FC 5h 0.9694), b, Car5a locus (ANOVA, F3,18 = 5.419, *p<0.01 Dunnett’s post-hoc tests: Ctx A vs FC 0h p = 0.0344, Ctx A vs FC 1h p = 0.9087, Ctx A vs FC 5h p = 0.6681) c, Inst2 (ANOVA, F3,18 = 5.459, *p<0.01; Dunnett’s post-hoc tests: Ctx A vs FC 0h p = 0.0142, Ctx A vs FC 1h p = 0.999, Ctx A vs FC 5h p = 0.9496), and f, Snap47 locus (ANOVA, F3,18 = 5.214, *p<0.01, Dunnett’s post-hoc tests: Ctx A vs FC 0h p = 0.0209, Ctx A vs FC 1h p = 0.9807, Ctx A vs FC 5h p = 0.9316). d, Model depicting the transition from B-DNA to Z-DNA during fear conditioning and from Z-DNA to B-DNA during fear extinction. There was also a significant alteration in Z-DNA when comparing fear-trained animals exposed to a novel context following fear conditioning (retention control: RC) to fear-conditioning followed by 10CS (EXT 10), 30CS (EXT 30), or 60CS extinction (EXT 60). Specifically, Z-DNA significantly decreased at the e, Nrxn3 locus (n = 6–8 animals per group from a single cohort, ANOVA F3,23 = 39.48 ****p<0.0001, Dunnett’s post-hoc tests: RC vs EXT 10 p = 0.0879 RC vs EXT 30 ****p <0.0001, RC vs EXT 60 <0.0001), i, Car5a locus (ANOVA F(3,22) = 32.94 ****p<0.0001, Dunnett’s post-hoc tests: RC vs EXT 10 p = 0.9031 RC vs EXT 30 ****p <0.0001, RC vs EXT 60 ****p<0.0001), f, Inst2 locus (ANOVA, F3,25 = 13.88, ****p<0.0001, Dunnett’s post-hoc tests: RC vs EXT 10 p = 0.9920, RC vs EXT 30 p = 0.0009, RC vs EXT 60 p = 0.0002), and g, Snap47 locus (ANOVA, F3,23 = 34.88, ****p<0.0001, Dunnett’s post-hoc tests: RC vs EXT 10 p = 0.3363, RC vs EXT 30 ****p < 0.0001, RC vs EXT 60 ****p<0.0001).
