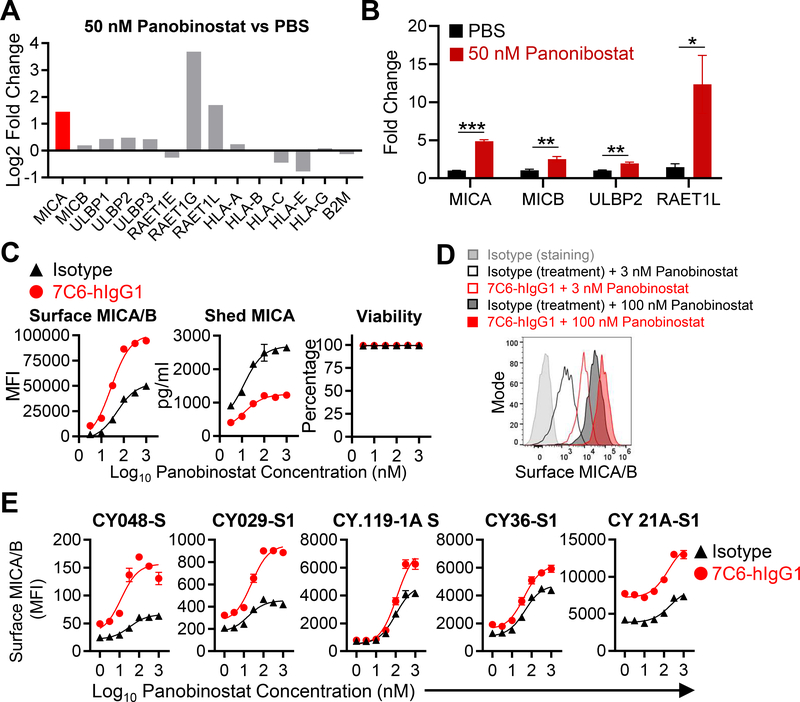
Figure 5. The combination of the HDAC inhibitor panobinostat and a MICA/B mAb enhances surface expression of MICA/B on tumor cells.
(A) NKG2D ligand mRNA expression following treatment with panobinostat. A375 cells were treated for 24 hours with panobinostat (50 nM), and mRNA was extracted for bulk RNA-seq. mRNA expression for NKG2D ligand and MHC class I genes are shown as ratio (log2 fold-change) for the panobinostat and PBS groups. (B) A375 cells were treated for 24 hours with panobinostat (50 nM) or solvent control (PBS), and the expression of the indicated genes was analyzed by RT-qPCR (triplicates per condition). *p<0.05, **p<0.01, and ***p<0.001, statistical analysis was performed using two-tailed unpaired Student’s t-test with Welch’s correction. Error bars represent standard deviation of three technical replicates. (C) MICA/B surface protein levels following treatment with panobinostat plus MICA/B mAb. A375 cells were incubated with the indicated mAbs (20 μg/mL) and increasing concentrations of panobinostat for 24 hours. MICA/B surface expression (left) and A375 cell viability (right) were quantified by flow cytometry. MICA that was shed into the supernatant was quantified by sandwich ELISA (middle). (D) Representative histograms of the data shown in (C). (E) Treatment of short-term human melanoma cell lines with the combination of panobinostat plus MICA/B mAb. The indicated melanoma cell lines were treated in vitro with the indicated mAbs (20 μg/mL) plus increasing concentrations of panobinostat for 24 hours. MICA/B surface expression was quantified by flow cytometry. Cell lines had different basal and induced expression of MICA/B and were ordered from low to high MICA/B expression. Data representative of three independent experiments (B-C and E). SEM are shown (C and E).

