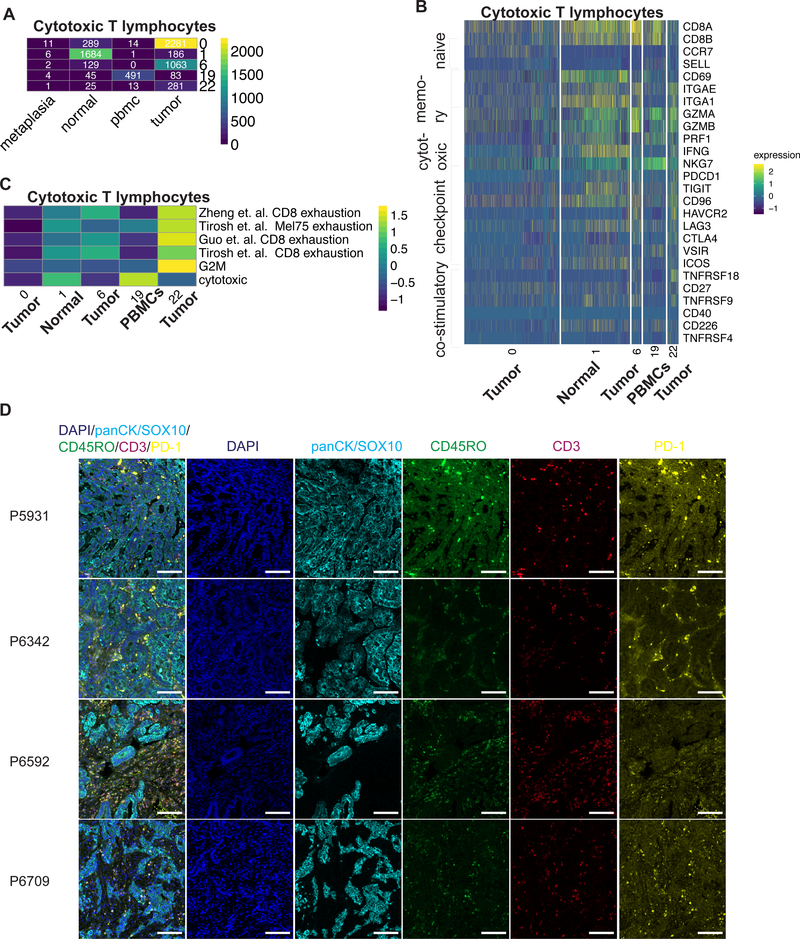
Figure 4:
(A) Heatmap depicting number of cytotoxic T cells identified for each cluster according the sample origin. (B) Heatmap depicting expression of respective genes from each cytotoxic T cell cluster. (C) Heatmap representing average GSVA enrichment score for respective exhaustion signature for each cluster. (D) Representative images of fluorescence staining for respective markers and merged image for respective patients. Scale bar indicates 100 μm

