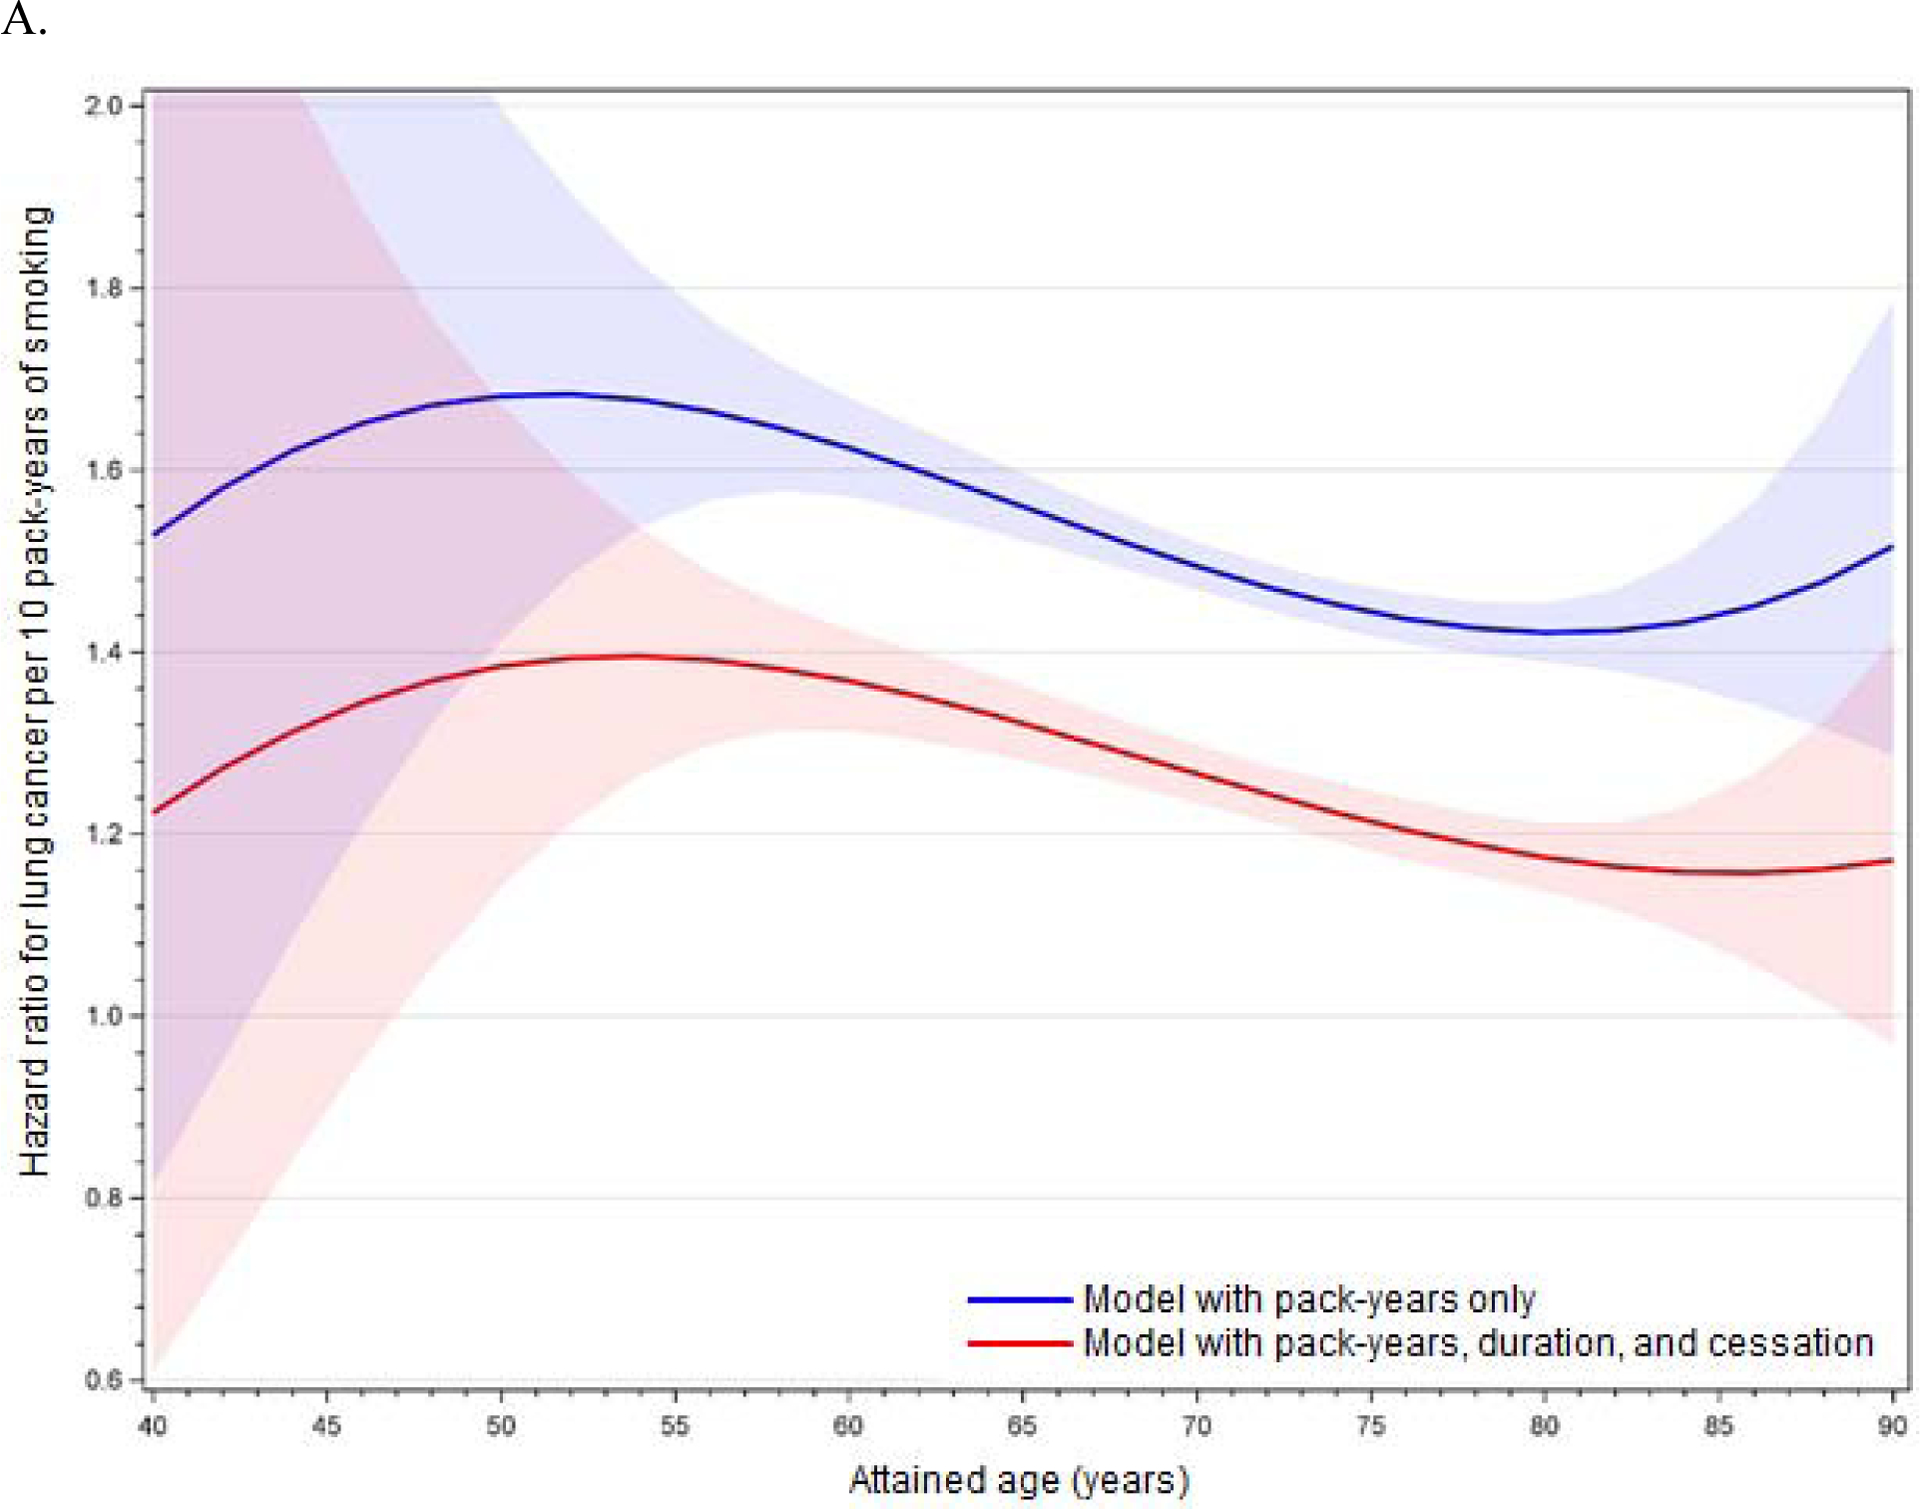
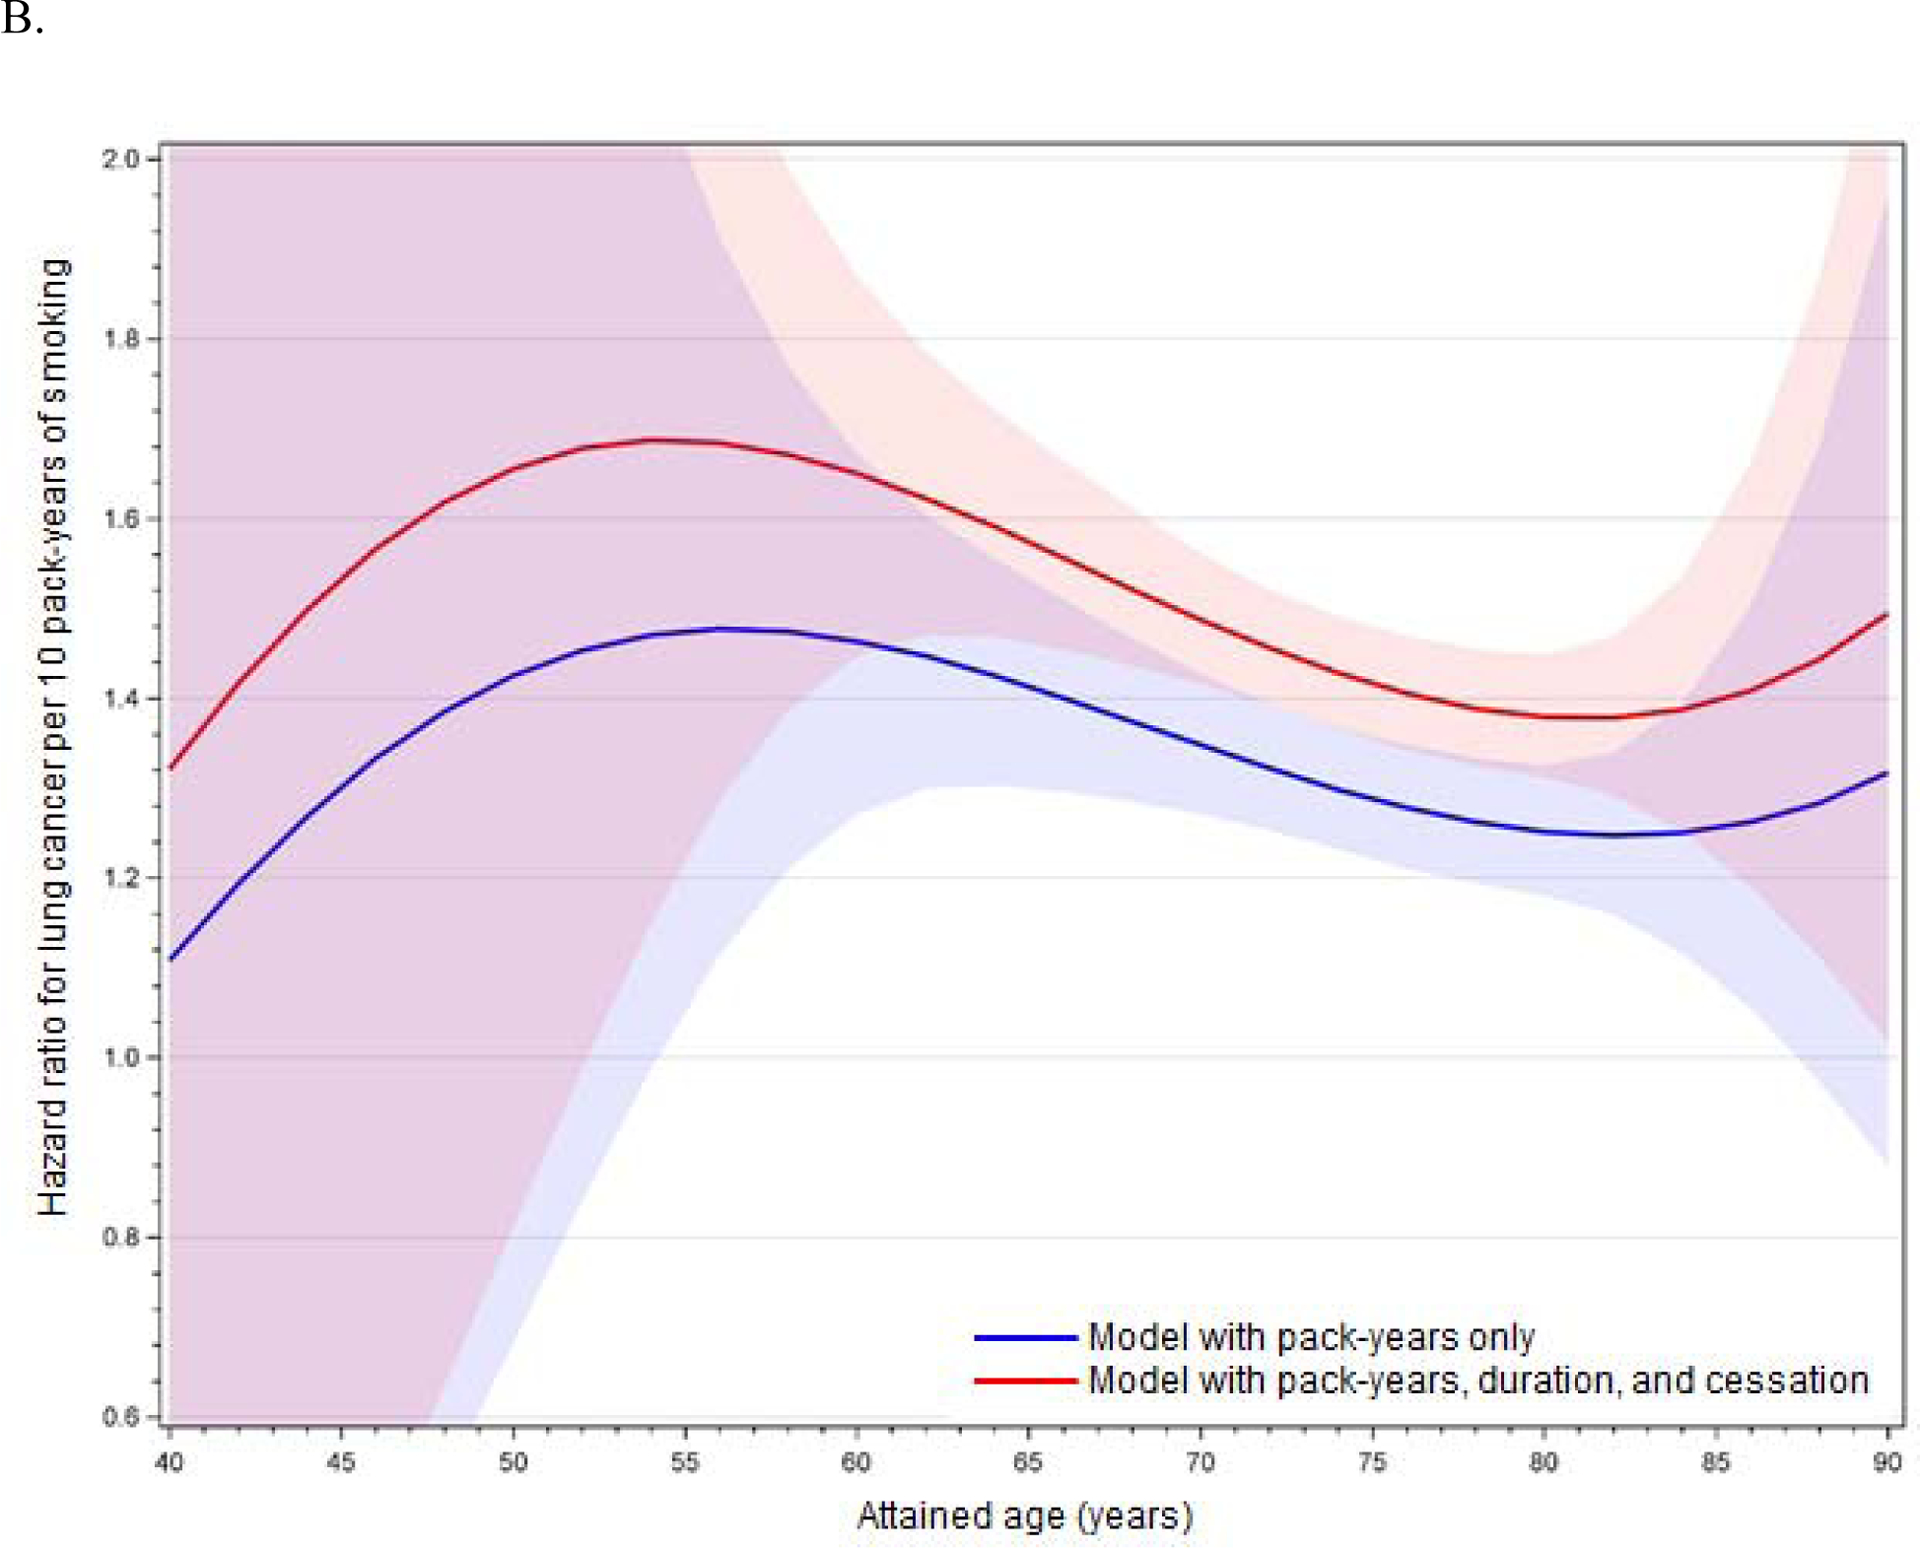
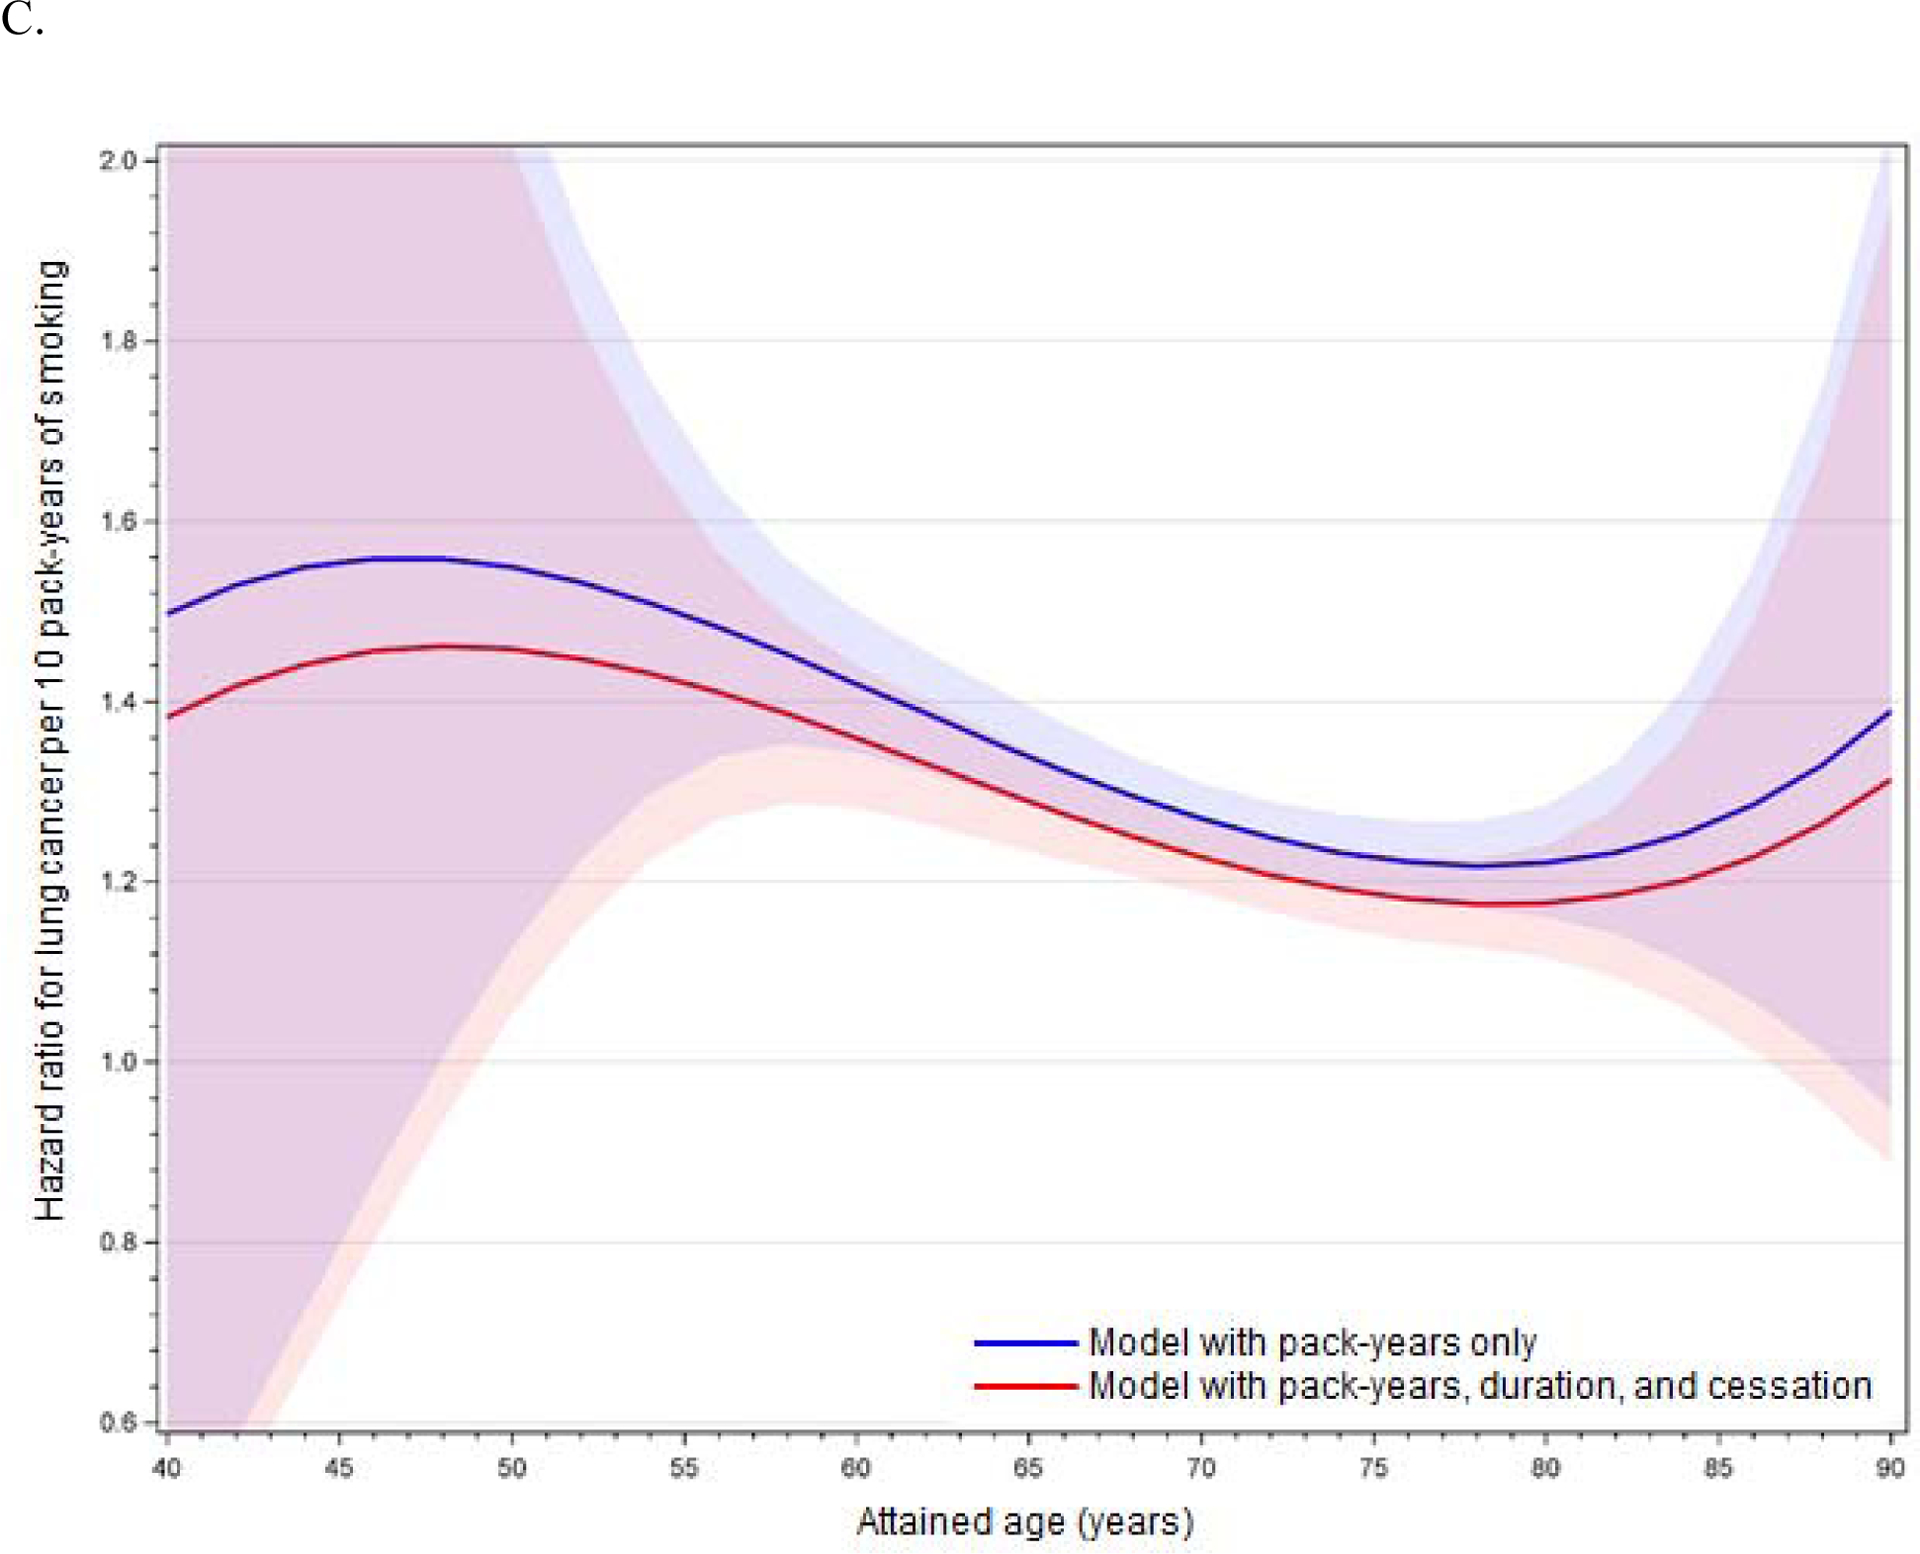
Figures 1A–C.


Age-related modification of cumulative pack-years in (A) the full cohort, (B) former smokers, and (C) current smokers, using fully adjusted models. Lines illustrate the hazard ratio per 10 pack-years of smoking, and shading illustrates 95% confidence intervals around the hazard ratio. Red denotes models including PM2.5 and cumulative pack-years only (with age interactions), and blue denotes models including PM2.5, cumulative pack-years (with age interactions), years of smoking, and months since cessation.
