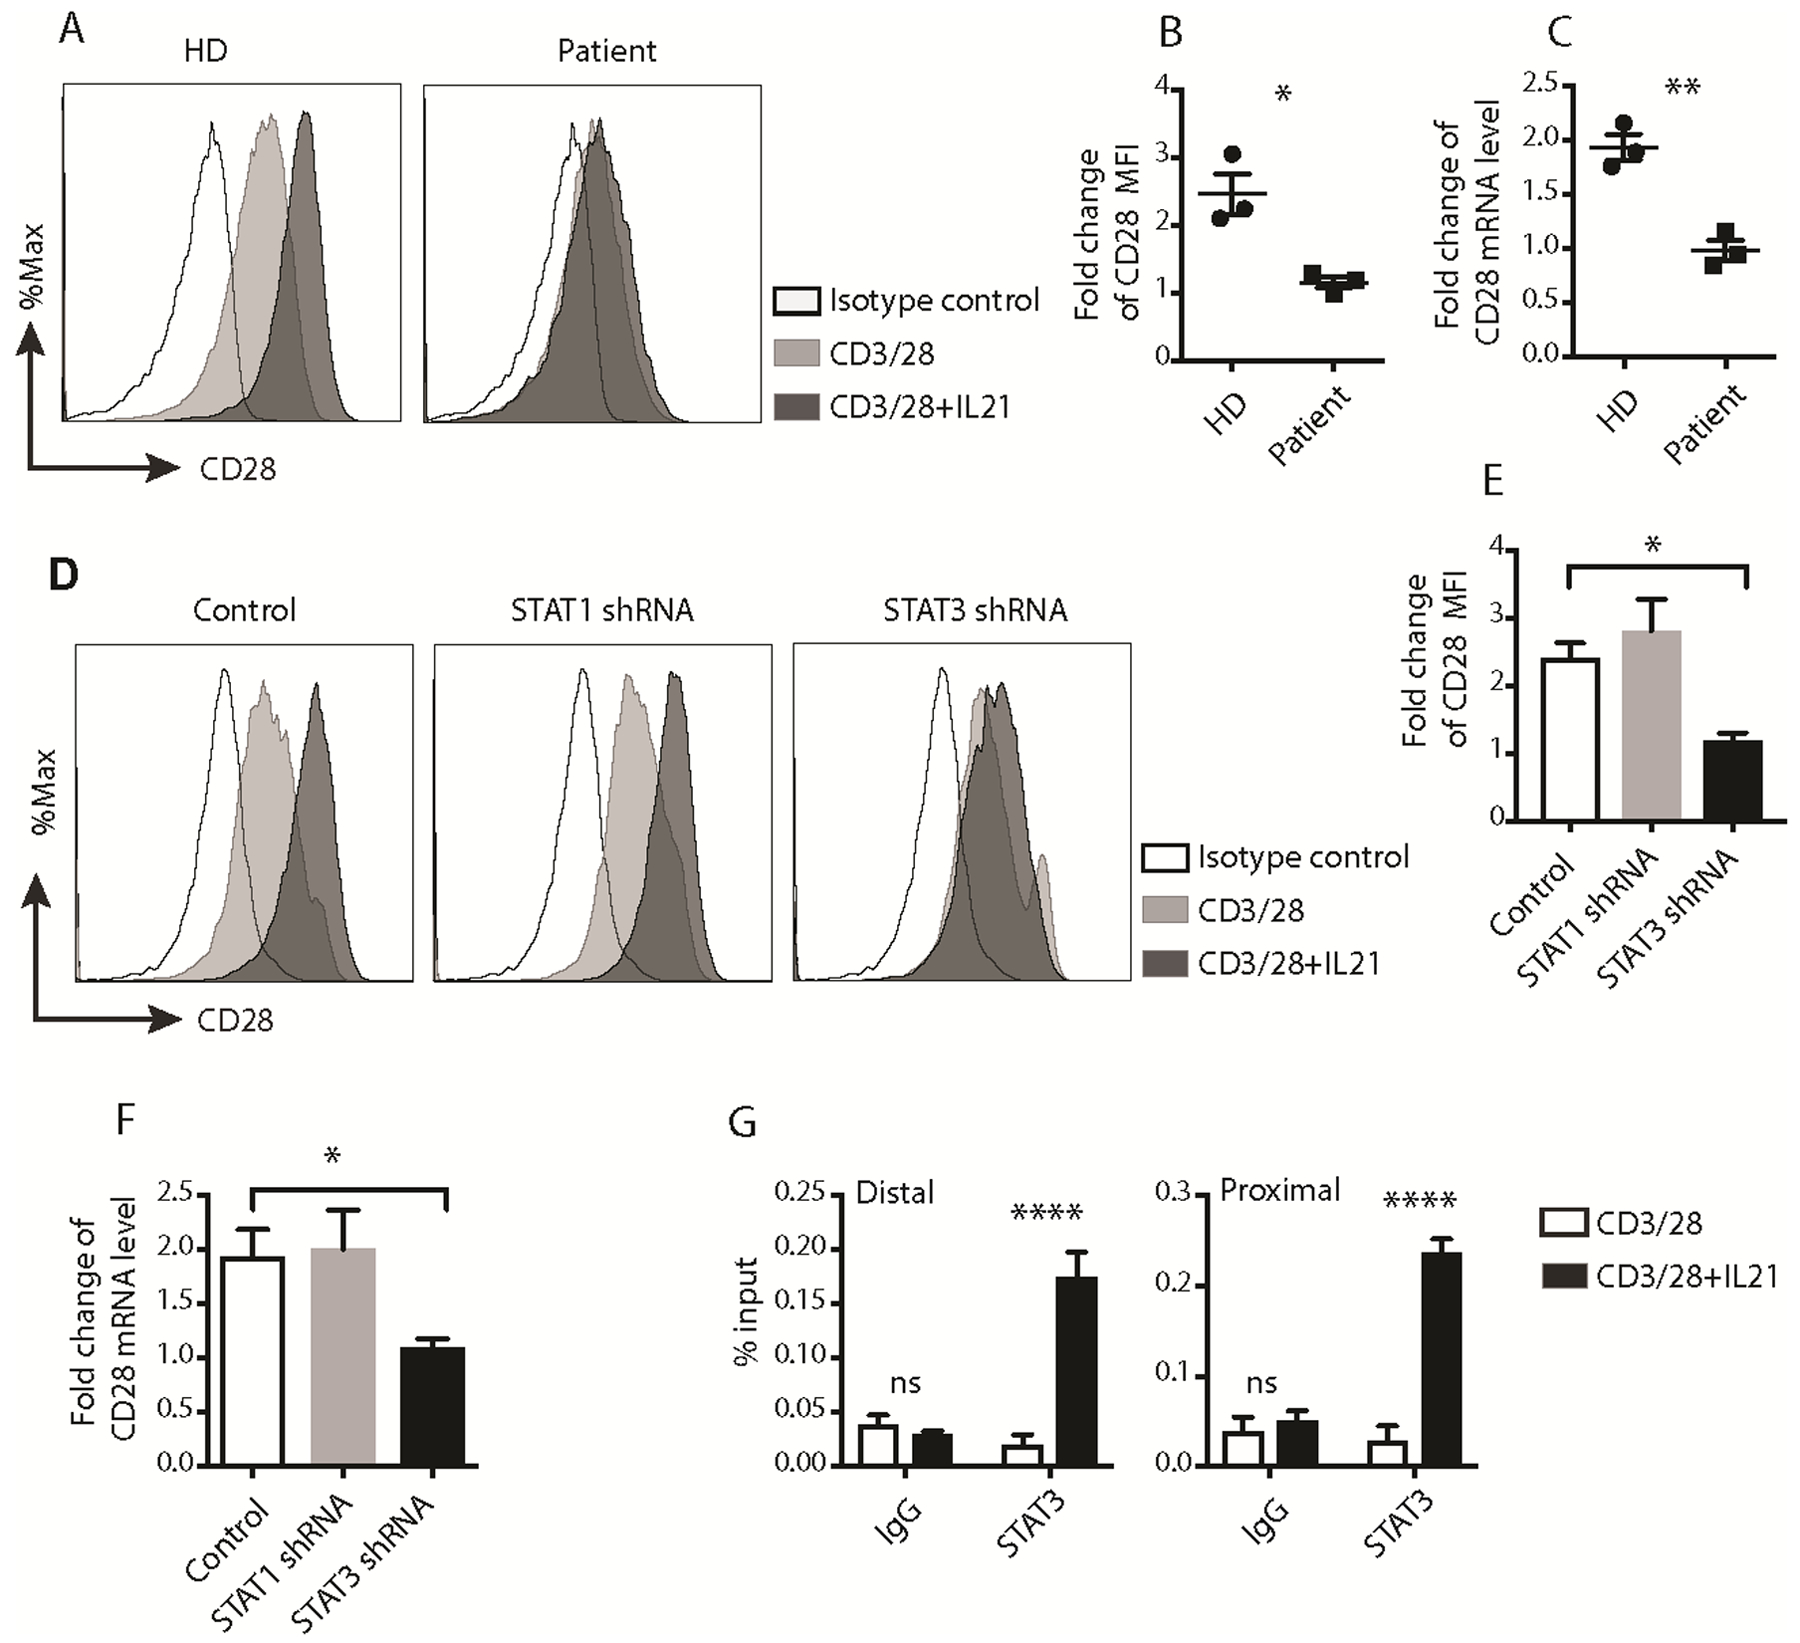
Fig. 2. STAT3 activation was essential for IL21-induced CD28 upregulation.

(A) Representative histograms of CD28 surface expression on activated human CD8+ T cells from healthy donors or Job’s syndrome patients. HD: healthy donor. (B) Fold change of CD28 MFI, which is presented as fold of MFI of cells activated with anti-CD3/CD28 and IL21 over MFI of cells activated with only anti-CD3/CD28. (n=3, mean ± SEM, * p < 0.05, unpaired t test). (C) Fold change of quantitative RT-PCR results of CD28 mRNA in human CD8+ T cells from healthy donors or Job’s syndrome patients activated with anti-CD3/CD28 or together with IL21 for 7 days. The expression in cells from healthy donor or Job’s syndrome patient activated with anti-CD3/28 beads alone for 7 days was set as 1. (n=3, mean ± SEM, ** p < 0.01, unpaired t test). (D) Representative histograms of CD28 surface expression on human CD8+ T cells transfected with control, STAT1 or STAT3 shRNAs and activated with the indicated conditions for 7 days. (E) Fold change of CD28 MFI on the surface of negative control (Control) or STAT-knockdown CD8+ T cells activated with the indicated conditions for 7 days. Data is presented as fold of MFI of cells activated with anti-CD3/CD28 and IL21 over MFI of cells activated with only anti-CD3/CD28. (n=6, mean ± SEM, * p < 0.05, one-way ANOVA). (F) Fold change of quantitative PCR results of CD28 mRNA in human CD8+ T cells transfected with control, STAT1 or STAT3 shRNAs and activated with anti-CD3/CD28 or together with IL21 for 7 days. The expression in cells activated with CD3/28 beads alone for 7 days was set as 1. (n=4, mean ± SEM, * p < 0.05, one-way ANOVA). (G) Representative ChIP results of STAT3 binding to the proximal and distal STAT sites on the human CD28 promoter. The results were normalized to the percentage of the input amount. (n=3, mean ± SEM, **** p < 0.0001, two-way ANOVA). The results were representative (A, D, G) or pooled from 3 (B, C), 4 (F), or 6 (E) independent experiments using cells from different donors.
