
Fig. 4. SAHA allowed IL21 to upregulate CD28 expression in effector CD8+ T cells.
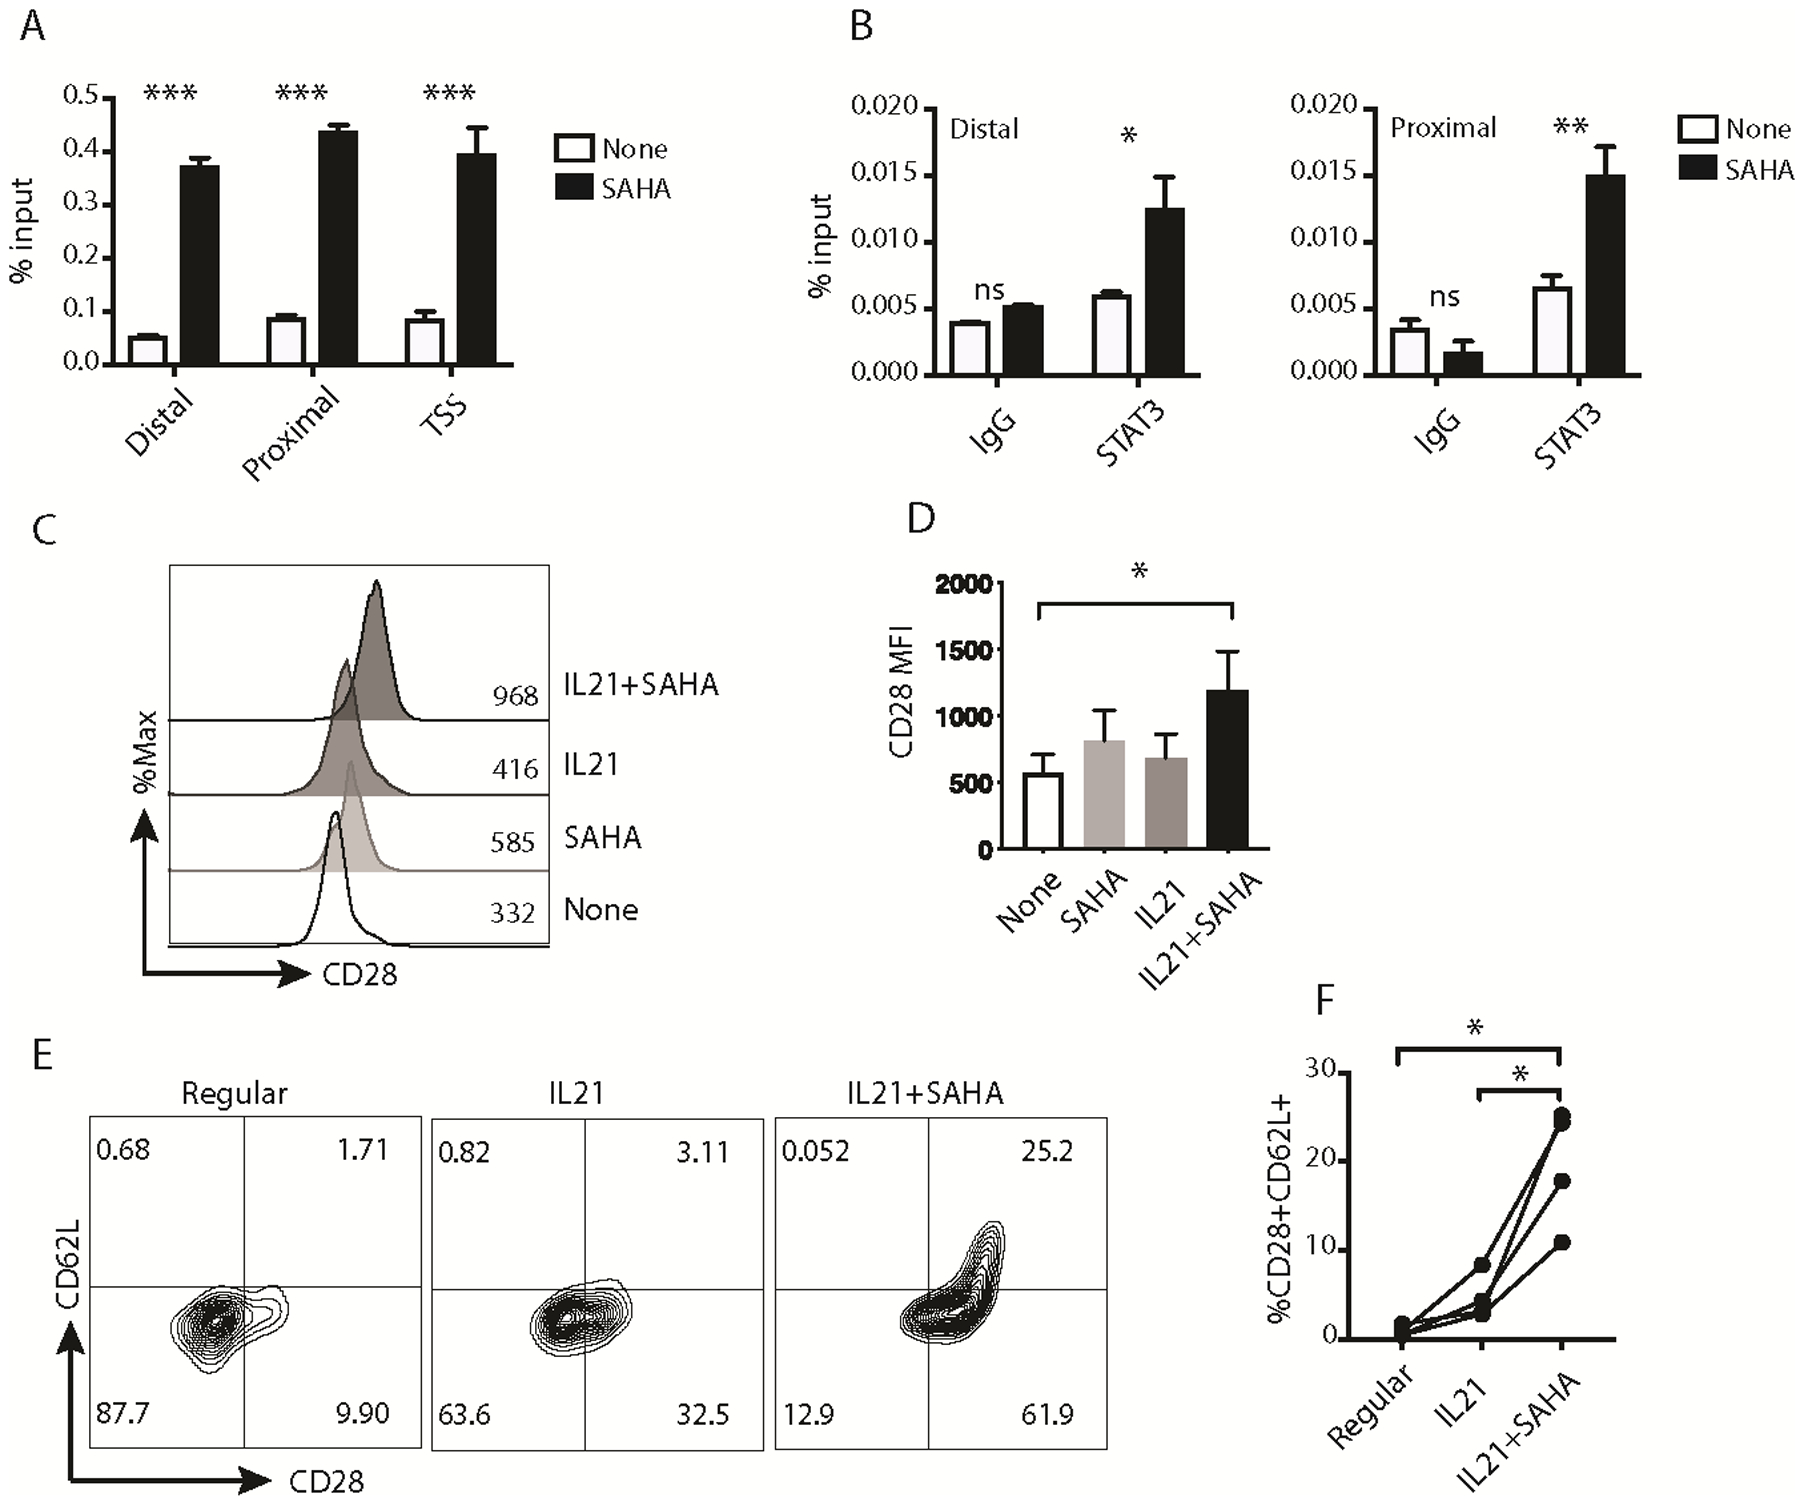
(A) Representative ChIP results of H3 acetylation on the CD28 promoter for M27-specific effector CD8+ T cells left untreated (None) or treated with SAHA for 24 hours. [n=3; mean ± SEM; *** p<0.001; two-way ANOVA]. (B) Representative ChIP results of STAT3 binding to the CD28 promoter for M27-specific effector CD8+ T cells left untreated or treated with SAHA for 24 hours, followed by IL21 stimulation for 30 minutes. [n=3; mean ± SEM; ns: not significant, * p<0.05, ** p<0.01; two-way ANOVA]. (C) Representative histogram of CD28 expression on activated CTLs treated with the indicated conditions for 4 days. The numbers inside the histogram graph show the representative CD28 MFI for each condition. (D) MFI of CD28 on CTLs from independent experiments (n=6; mean ± SEM; * p<0.05; one-way ANOVA, comparing IL21+SAHA to the other conditions). (E) Representative plots of CD28 and CD62L expression on TILs expanded with the indicated conditions for 2 weeks. The numbers within the plots annotate the percentage of cells in each quadrant. (F) Percentage of CD28+CD62L+ cells in TILs expanded with the indicated conditions from independent experiments (n=4; * p<0.05; one-way ANOVA). The representative results out of two (B), three (A), four (E), or six (C) independent experiments are shown.