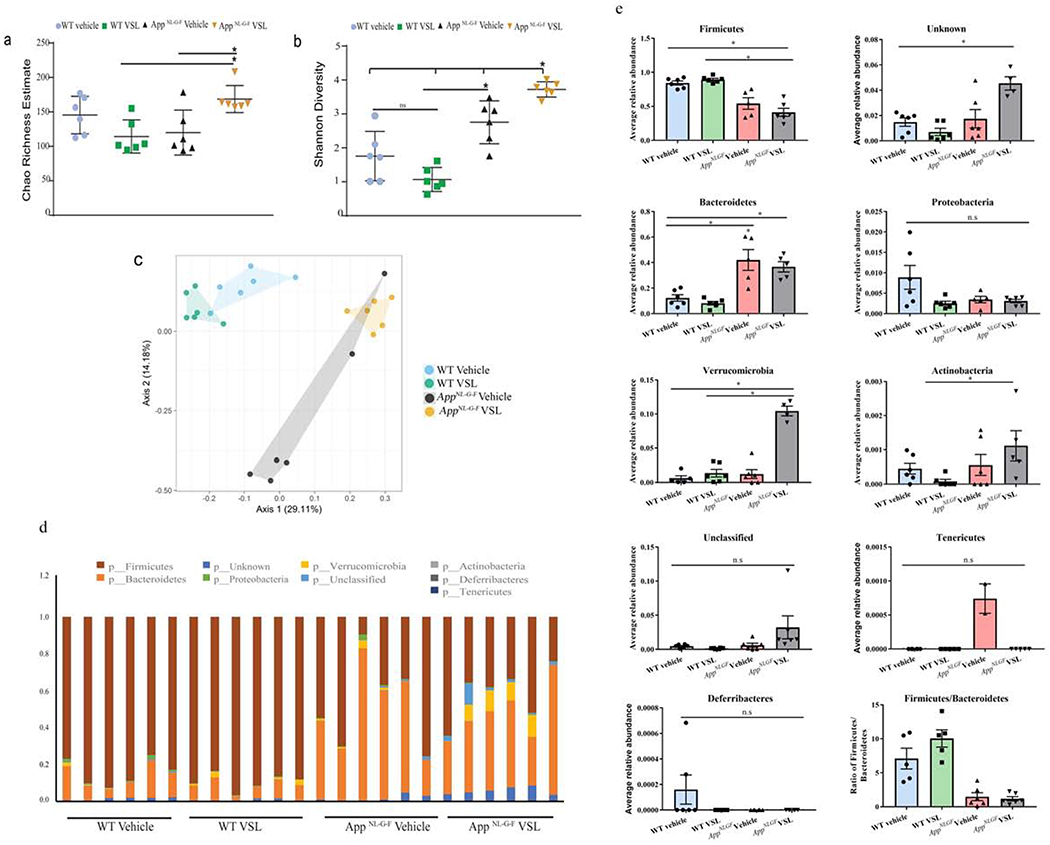
Fig. 1.
Gut bacterial phyla profile in AppNL-G-F mice and effects of VSL#3 probiotic supplementation. Microbial richness was calculated based on Chao1 index (a) and microbial richness and evenness on the Shannon index (b). The mean value (and confidence interval) in each group are also illustrated (c). Principle coordinate analyses (PCoA) plot for unweighted UniFrac distances between C57BL/6 (WT) and AppNL-G-F mice (d). Relative abundance of dominant bacterial phyla in fecal samples of C57BL/6 (WT) and AppNL-G-F mice. The relative abundances are based on the proportional frequencies of the DNA sequences that were classified at the phylum level. 6 animals per group were examined (e) Each bar graphs shows the different bacterial phylum altered in AppNL-G-F mice when compared to C57BL/6 (WT) vehicle treated mice. Data are represented as mean ± S.E.M. Significant differences were determined by two-way analysis of variance (ANOVA), * p<0.05 (n=6). The statistical analysis was not performed on phylum Deferribacteres and Tenericutes due to less average relative abundance of these phyla.

