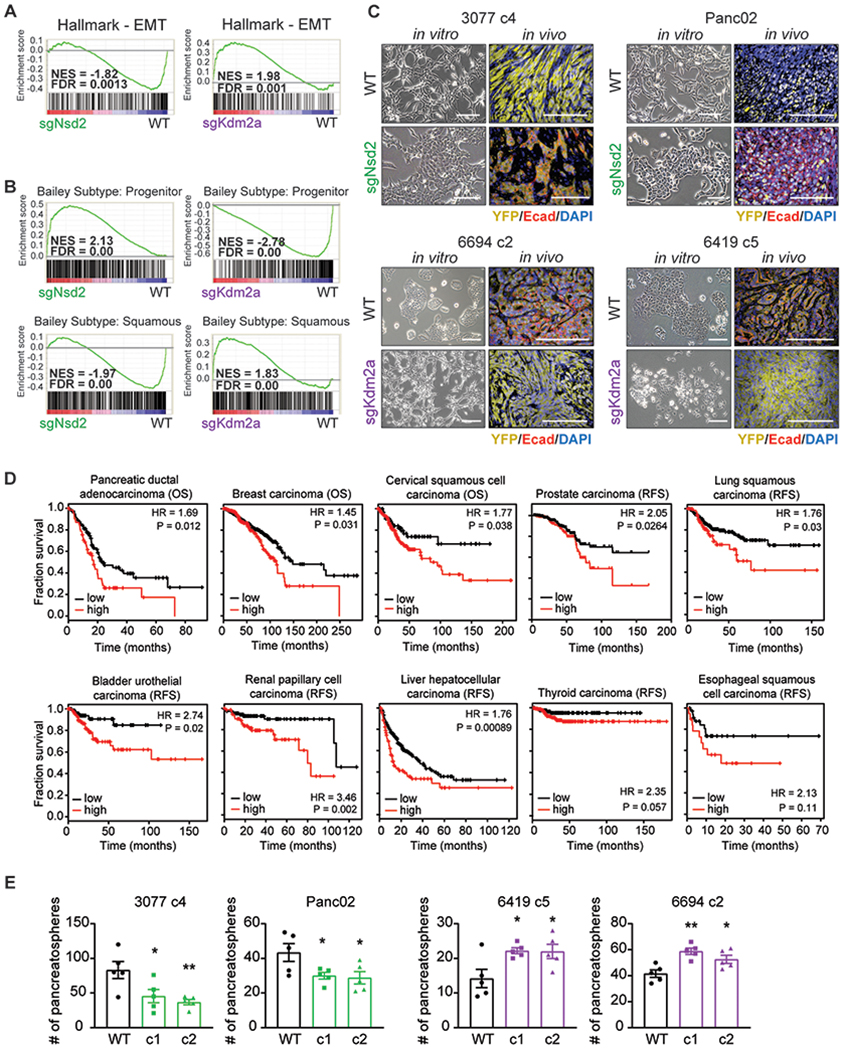
Figure 2: Nsd2 and Kdm2a have reciprocal effects on tumor differentiation and tumor initiation.

(A) Gene set enrichment analyses (GSEA) of WT versus sgNsd2 (left) or sgKdm2a (right) RNA-seq using the EMT Hallmark signature. Normalized enrichment score (NES) and false discovery rate (FDR) are shown alongside.
(B) GSEA plots evaluating the Bailey squamous and progenitor signatures upon loss of Nsd2 (left) or Kdm2a (right).
(C) Representative in vitro brightfield (BF, left) and in vivo immunofluorescent (IF, right) images of orthotopic tumors derived from cell lines with the indicated genotypes. Co-staining for Ecad (red), YFP (yellow), and DAPI (blue). Scale bars = 100μm.
(D) Kaplan-Meier plots of overall survival (OS) or relapse-free survival (RFS) of patients, stratified by high (red) or low (black) expression of a gene signature that represents the average expression level of NSD1, NSD2, and NSD3. Median expression of this gene signature was used as the cutoff. RNA-seq and clinical data was obtained from the KM plotter database and includes datasets deposited in TCGA and GEO (Nagy et al., 2018). P-value was calculated by log rank test.
(E) Number of pancreatospheres formed from 2,500 cells of the indicated cell lines and genotype (n=5 technical replicates, error bars indicate SEM). Statistical analysis by Student’s unpaired t-test with significance indicated (*, p<0.05; **, p<0.01; ***, p<0.001; ****, p<0.0001).
