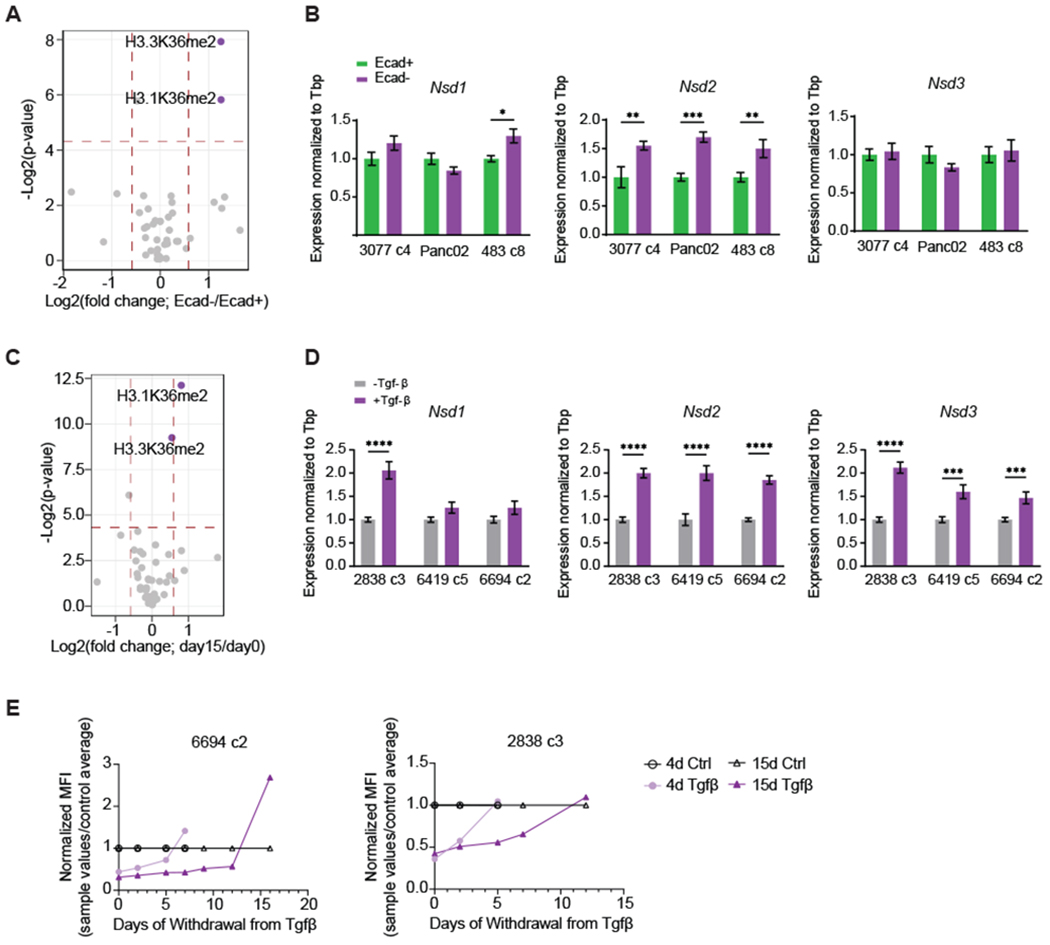
Figure 4: Upregulation of H3K36me2 is associated with the mesenchymal state.

(A) Volcano plot presenting log2-transformed p-value and fold change of histone H3 and H4 single post-translational modification (PTM) relative abundance derived from mass spectrometry for Ecad− vs. Ecad+ sorted cells. Two variants for histone H3, the canonical H3.1 and non-canonical H3.3, which are both known to accumulate K36me2, are shown. Horizontal dotted line demarcates Student’s unpaired t-test p-value < 0.05, while vertical dotted lines demarcate ± 1.5-fold change (n=3 cell lines). H3K36me2 marks are labeled and represented in purple. When Holm Sidak correction for multiple testing is applied, Padj=0.05 (H3.1K36me2) and 0.028 (H3.3K36me2).
(B) Relative mRNA expression of Nsd1, Nsd2, and Nsd3 in sorted Ecad+ (green) and Ecad− (purple) cells. Results from 3 different cell lines are shown. Bars represent mean ± SEM.
(C) Volcano plot presenting log2-transformed p-value and fold change of histone H3 and H4 single post-translational modification (PTM) relative abundance derived from mass spectrometry for cells undergoing 15 days of Tgf-β treatment vs. citric acid control. Horizontal dotted line demarcates Student’s unpaired t-test p-value < 0.05, while vertical dotted lines demarcate ± 1.5-fold change (n=3 cell lines). When Holm Sidak correction for multiple testing is applied, Padj=0.00001 (H3.1K36me2 and H3.3K36me2).
(D) Relative mRNA expression of Nsd1, Nsd2, and Nsd3 in cells treated with Tgf-β for 15 days. Results from 3 different cell lines are shown. Bars represent mean ± SEM.
(E) Normalized mean fluorescence intensity (MFI) of Ecad in control cells and cells treated with Tgf-β for 4 or 15 days, followed by withdrawal of Tgf-β for the number of days indicated on the x-axis. MFI for the 4 and 15-day treated samples were normalized to their respective controls. Experiments were performed in 2 cell lines.
