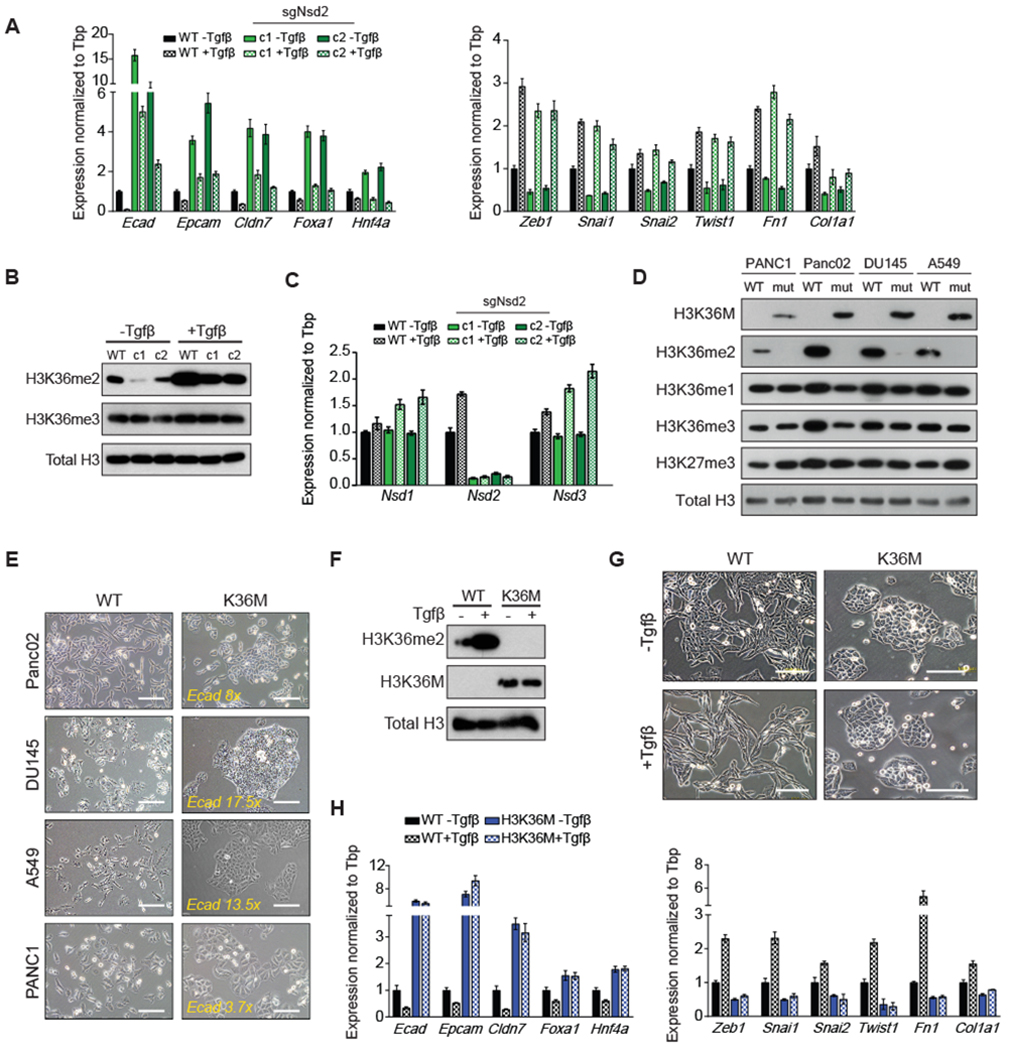
Figure 5: Upregulation of H3K36me2 is essential for EMT.

(A) Relative mRNA expression of epithelial genes (left) and mesenchymal genes (right) in WT and sgNsd2 clones, with or without 15 days of Tgf-β treatment, as determined by qPCR (n = 3, mean ± SEM).
(B) Western blots of acid-extracted histones from WT and sgNsd2 clones, with or without 15 days of Tgf-β treatment.
(C) Relative mRNA expression of Nsd1, Nsd2, and Nsd3 in WT and sgNsd2 clones, with or without 15 days of Tgf-β treatment, as determined by qPCR (n = 3, mean ± SEM).
(D-E) Western blots of acid-extracted histones (D) and BF images (E) from cell lines expressing WT or K36M H3F3A (scale bars = 100μm). Fold change increases in Ecad mRNA expression in K36M samples were determined by qPCR (see Supplementary Figure S11) and indicated in yellow.
(F-H) Western blots of acid-extracted histones (F), BF images (scale bars = 100μm) (G), and relative mRNA expression of epithelial genes (left) and mesenchymal genes (right) (H) from cells expressing WT or K36M H3F3A, with or without 15 days of Tgf-β treatment. mRNA expression was determined by qPCR (n = 3, mean ±SEM).
