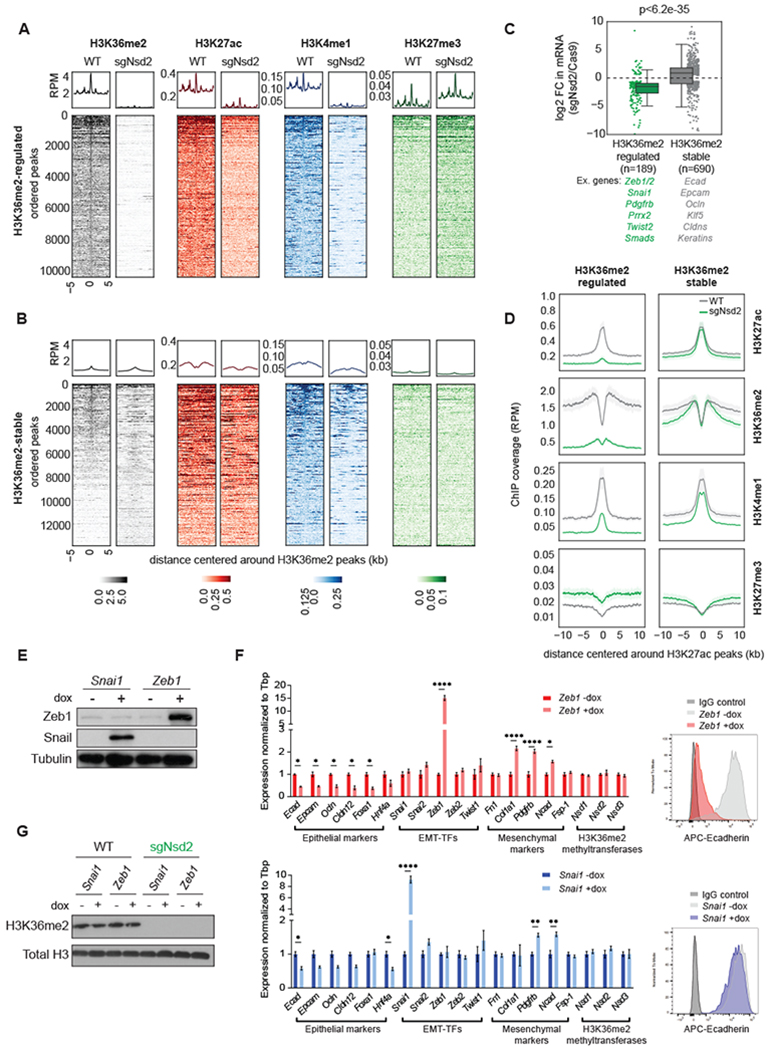
Figure 6: Changes in H3K36me2 levels reprogram enhancers associated with master EMT regulatory factors.

(A-B) Aggregate plots and heatmaps of ChIP signal of the indicated histone marks in WT and sgNsd2 samples, centered around H3K36me2 peaks that are lost with sgNsd2 (i.e. H3K36me2-regulated, n=10312 total peaks) (A) and H3K36me2 peaks that are not lost with sgNsd2 (i.e. H3K36me2-stable, n=13575 total peaks) (B).
(C) Boxplots of log2fold change of mRNA expression of genes associated with H3K36me2-regulated peaks (n=189 genes) and H3K36me2-stable peaks (n=690 genes). Examples are listed below each group.
(D) Aggregate plots comparing the average ChIP signal of the indicated histone marks in WT (grey) and sgNsd2 (green) samples centered around putative enhancers, defined here as H3K27ac peaks that are more than +/− 2.5kb outside of TSS.
(E) Western blots of cell lysates from sgNsd2 cells expressing dox-inducible Zeb1 or Snai1 expression vectors. Cells were treated with dox for 4 days or left untreated.
(F) Relative mRNA expression of epithelial markers, EMT-TFs, mesenchymal markers, and H3K36me2 methyltransferases (left) and flow plots of Ecad staining (right) in sgNsd2 cells expressing dox-inducible Zeb1 (top) or Snai1 (bottom) expression vectors. Cells were treated with dox for 4 days or left untreated. Bars represent mean ± SEM. Statistical analysis by Student’s unpaired t-test with significance indicated (*, p<0.05; **, p<0.01; ***, p<0.001; ****, p<0.0001).
(G) Western blots of acid-extracted histones from WT and sgNsd2 cells expressing dox-inducible Zeb1 or Snai1 expression vectors. Cells were treated with dox for 4 days or left untreated.
