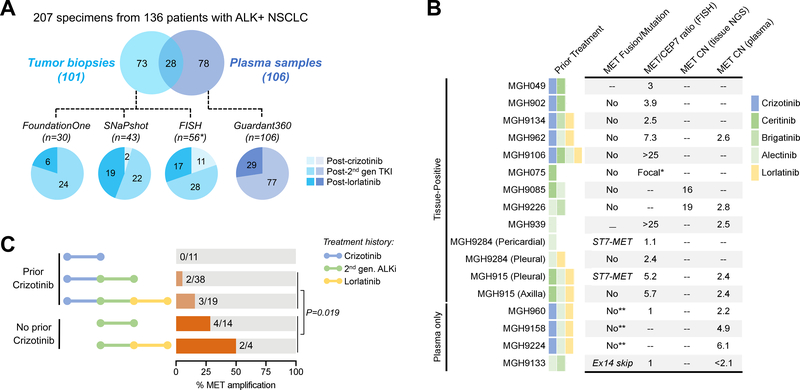
Figure 1. Summary of MET Alterations in Resistant ALK-Positive NSCLC.
(A) Schematic depicts number of specimens analyzed using four different assays. Pie charts are color-coded to reflect whether specimens were tissue (blue) or plasma (purple). The ALK inhibitor received immediately prior to biopsy is shown. The SNaPshot cohort includes specimens genotyped using both SNaPshot and Solid Fusion Assays. Asterisk (*) includes 28 cases analyzed by both FISH and SNaPshot/Solid Fusion Assay. One patient (MGH915) had molecular profiling of two disease sites at relapse on lorlatinib but is only counted once in the FISH cohort given identical findings at both sites. TKI: tyrosine kinase inhibitor; 2nd gen: second-generation (B) Table lists MET alterations identified in resistant specimens. *MGH075 had focal MET amplification that was too variable to estimate copy number or MET/CEP7. **Plasma testing evaluated MET mutations but did not assess for MET rearrangement. MET/CEP7: ratio of MET to centromere 7 probe; CN: copy number; FISH: fluorescence in-situ hybridization; NGS: next-generation sequencing, ex14 skip: exon 14 skipping. (C) Bar graphs illustrate frequency of MET amplification according to prior ALK inhibitors received. The p-value corresponds to the comparison of MET amplification frequency in crizotinib-naïve vs crizotinib-pretreated patients who received next-generation ALK inhibitors. 2nd-gen. ALKi: second-generation ALK inhibitor.

