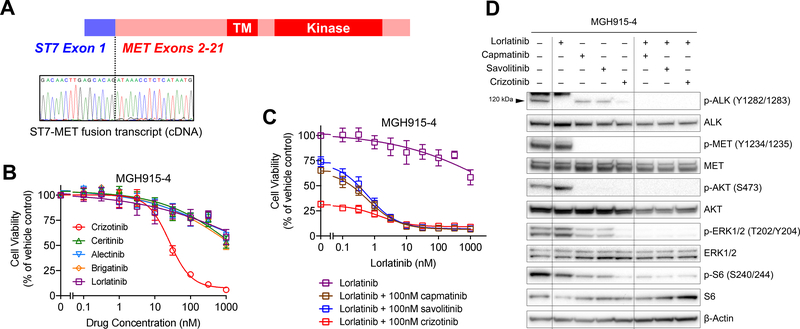
Figure 2. Acquired Resistance Due to ST7-MET and MET Amplification.
(A) Sanger sequencing of the RT-PCR product in MGH915’s lorlatinib-resistant pleural fluid sample shows fusion of ST7 exon 1 to MET exon 2. (B) and (C) Cell viability after 3 days of monotherapy or combination therapy, as indicated. Viability was determined using CellTiter-Glo. Data are mean ± s.e.m. of three biological replicates. (D) Immunoblotting to assess phosphorylation of ALK, MET, and downstream targets in cells treated with lorlatinib and the MET TKIs shown. The arrowhead at 120 kDa indicates the band for phospho-ALK. Cells were treated with each drug at 300 nM for 6 hours.

