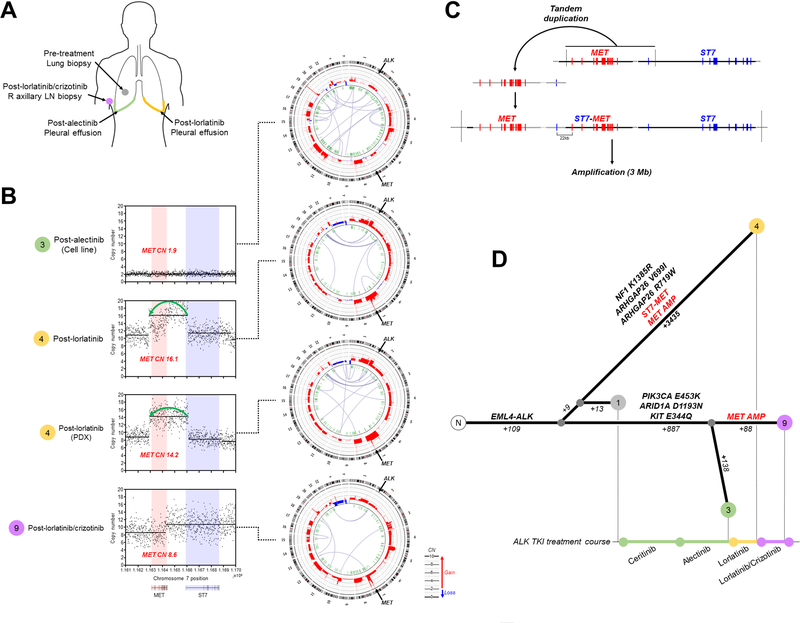
Figure 6. Convergent Evolution Upon MET Activation Drives Resistance to Lorlatinib.
(A) Metastatic disease sites analyzed by whole genome sequencing. (B) Copy number profiles of MET locus demonstrate amplification encompassing MET and first exon of ST7 in post-lorlatinib samples. Circos plots depicting chromosomal structure are shown on right. (C) Proposed sequence of genomic alterations leading to generation of ST7-MET fusion and amplification. The EML4-ALK rearrangement (*) and MET locus (**) are indicated. (D) Phylogenetic relationship of serial tumors samples based on shared and private mutations and MET alterations: MGH915–1 (pre-treatment tumor biopsy), MGH915–3 (cell line derived from post-alectinib pleural effusion), MGH914–4 (post-lorlatinib pleural effusion and patient-derived xenograft), MGH915–9 (post-lorlatinib/crizotinib axillary lymph node biopsy). Number of somatic mutations and selected mutations private to each branch point are indicated.

