Fig. 1.
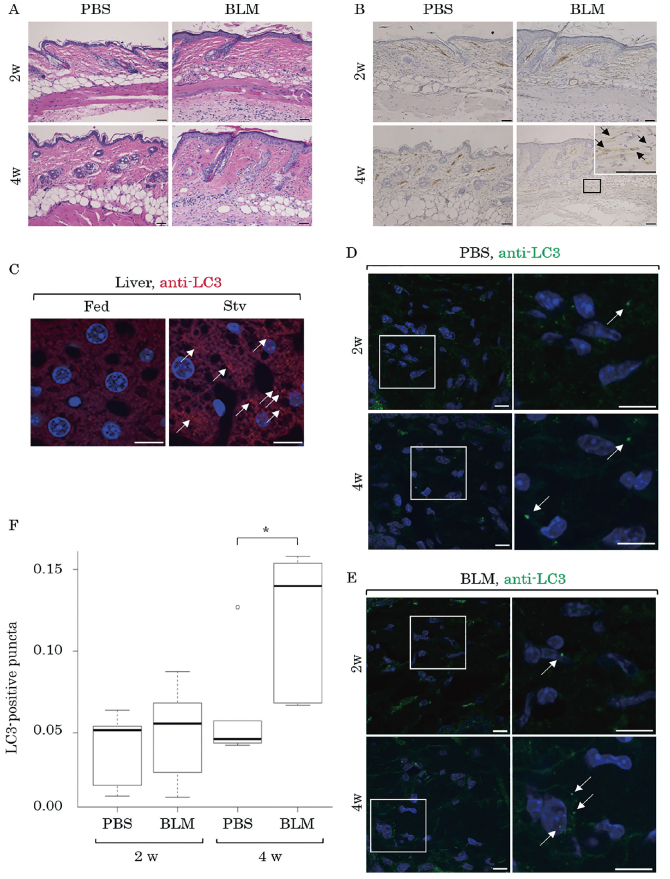
LC3-positive puncta in the skin of BLM-treated mice
Mice were treated with PBS or BLM for 2 weeks (2w) or 4 weeks (4w). The skin samples were examined by HE staining (A) or immunohistochemistry for αSMA (B). The boxed region is magnified and shown in the inset. The arrows indicate αSMA-positive myofibroblasts. Scale bars, 50 μm. Mouse livers with 24-hour starvation (Stv) or without (Fed) were processed for immunohistofluorescence microscopy analysis using anti-LC3 antibody (anti-LC3;red) followed by Alexa Fluor 594-conjugated secondary antibody (C). The nuclei were stained with Hoechst 33342 (blue). Scale bar, 10 μm. The skin samples from the mice treated with PBS (D) or BLM (E) for 2 weeks (2w) or 4 weeks (4w) were immunolabeled using anti-LC3 antibody (anti-LC3;green) followed by Alexa Fluor 488-conjugated secondary antibody. The nuclei were stained with Hoechst 33342 (blue). The boxed regions are magnified and shown on the right. The arrows indicate LC3-positive puncta observed in the dermis. Scale bars, 10 μm. LC3-positive puncta (number/nuclei) in ROIs were measured and are expressed as a box-and-whisker plot in F. The boxes indicate the upper and lower interquartile range (IQR), the lines within the boxes indicate the median, the whiskers indicate the minimum and maximum IQR, and the dot indicates the outlier. *:significant difference (P < 0.05 in Mann-Whitney U test).

