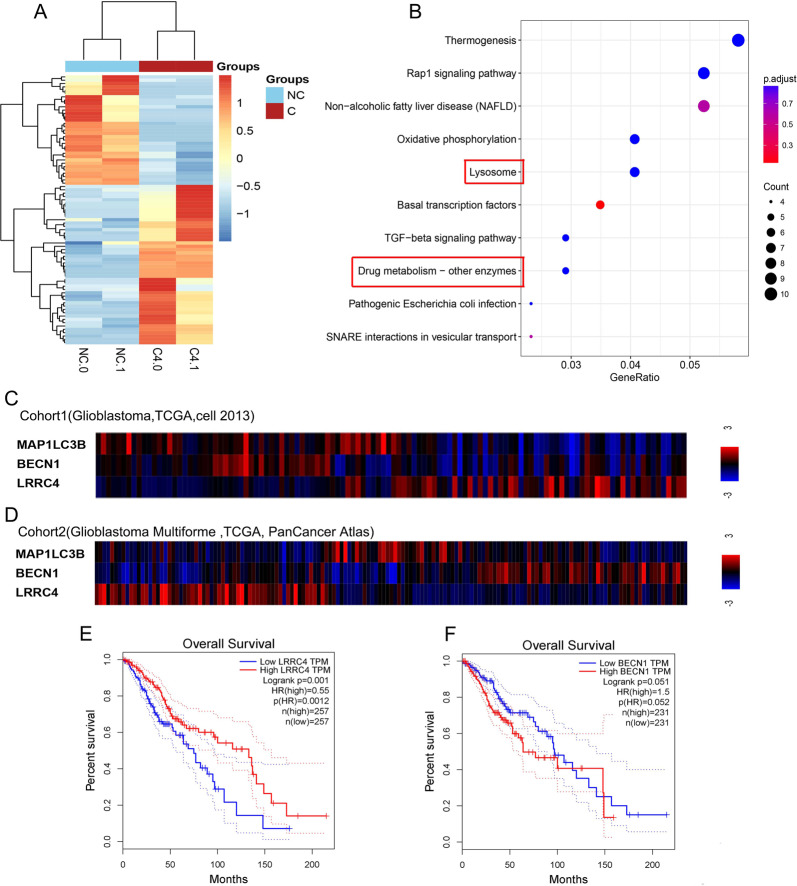
Fig. 1. LRRC4 is negatively associated with autophagy signals and glioma patient outcomes.
a Gene expression clustering diagram between U251 cells (NC: control) and U251 cells that stably expressed LRRC4 (C4: LRRC4). b KEGG pathway enrichment using differentially expressed genes between U251 cells (NC: control) and U251 cells that stably expressed LRRC4 (C4: LRRC4). The gene ratio means the proportion of genes related to this signalling pathway in the differentially expressed genes. Correlation analysis of LRRC4 and autophagy-related genes MAP1LC3Band BECN1 in Cohort 1 (Glioblastoma, TCGA, Cell 2013) (c) and Cohort 2 (Glioblastoma Multiforme, TCGA, PanCancer Atlas) (d) of GBM samples from TCGA database. Kaplan–Meier curve depicting survival of patients with low and high LRRC4 (e), BECN1 (f) in TCGA.

